

In technical analysis, reading price behaviour does not stop at a single tool; it requires combining multiple signals in the correct logical order. From determining the speed of a trend to identifying strong reversal signals such as Gaps or Island Reversals, each element plays its own role in the decision-making process.
The article below organises everything into the most understandable and easily applicable sequence.
The basics you need to grasp
- Every trend has its own speed and structure
- Reversal signals usually appear in stages
- Do not trade on a single indicator alone
- Read in the order “speed → structure → signal → confirmation”
- Confluence of multiple factors increases the probability
Speedline
The speedline measures the rate of increase/decrease of a trend by dividing it into key thresholds.
Characteristics:
- Divides the trend into 3 levels: 1/3 – 2/3 – the entire trend
- Reflects how “healthy” the trend is
Meaning:
- Breaking 1/3 → the trend begins to weaken
- Breaking 2/3 → high risk of reversal
- Breaking the entire line → confirms the trend has ended
Role:
It is the earliest signal showing that the trend is changing
Internal trendline
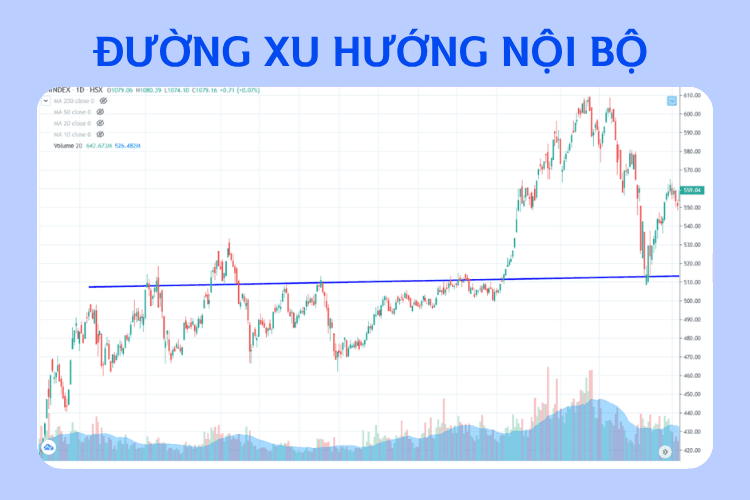
This is a flexible variant of the traditional trendline.
Characteristics:
- Does not need to pass through perfect highs/lows
- Closely follows actual price behaviour
Meaning:
- Helps identify support/resistance earlier
- Catches breakout points faster
Role:
It is the main structure of the trend, used for confirmation after the speedline
Reversal Day
This is a reversal signal that appears within a single trading session.
Characteristics:
- Breaks the high but closes low → bearish reversal
- Breaks the low but closes high → bullish reversal
- Often accompanied by a wide range
Meaning:
Shows that buying/selling pressure was “broken” during the day
Role:
It is a short-term timing signal for entering/exiting orders
Price Gap
A Gap is an empty price area between two consecutive trading sessions.
The main types of Gap:
Common Gap
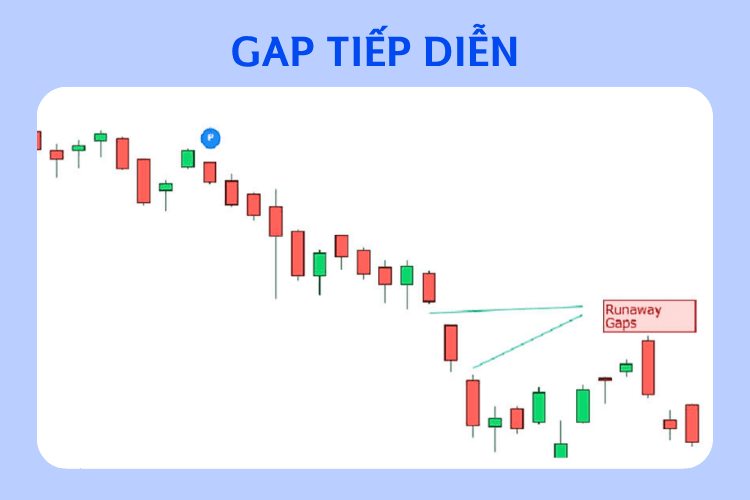
- Appears during sideways movement
- Of little significance
Breakaway Gap
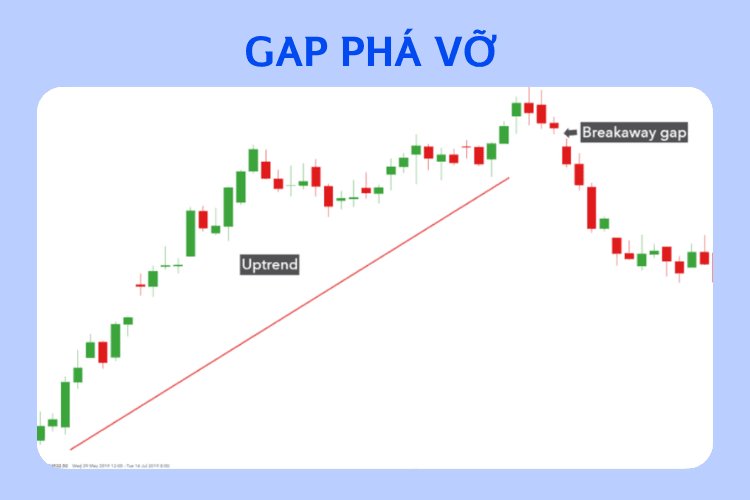
- Confirms the start of a new trend
Exhaustion Gap
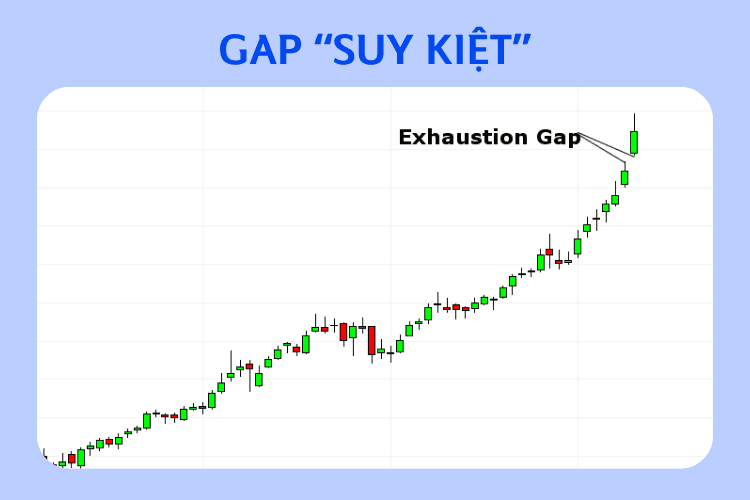
- Signals that the trend is about to end
Role:
Gaps help provide market context and cash flow
The “island” reversal pattern (Island Reversal)
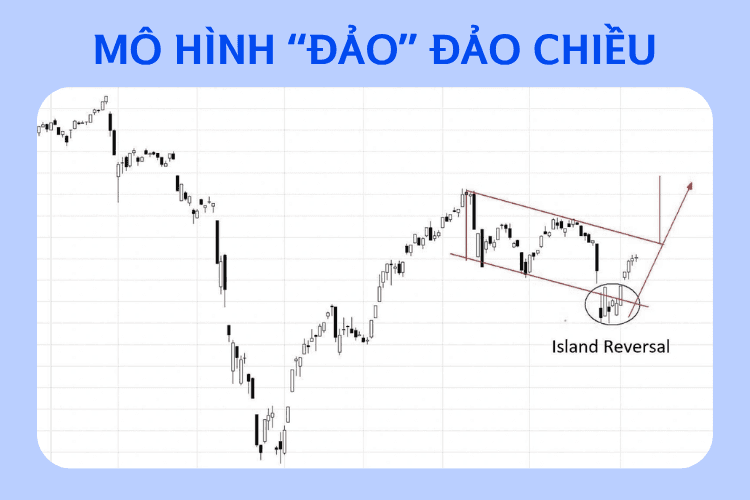
This is the strongest form of reversal in the Gap signal group.
Characteristics:
- 2 gaps appear in opposite directions
- Creates an “isolated” price zone
Meaning:
Shows a very strong shift in market sentiment
Role:
It is a powerful reversal confirmation signal
How to combine them in the standard order
This is the most important part:
1. Speed lines
→ Identify a trend that is weakening
2. Internal trend lines
→ Confirm that the structure is starting to break
3. Reversal day
→ Confirm that market momentum has turned
4. Gap
→ Provide context and cash flow momentum
5. Island Reversal
→ Confirm a strong reversal
A practical example
A stock in an uptrend:
- Breaks the 2/3 speedline
- Then breaks the internal trendline
- A wide-range reversal session appears
- Accompanied by a gap down
- And an Island Reversal forms
This is a very strong sequence of reversal signals with a high probability
Mistakes to avoid
Relying on a single signal
→ Easily distorted by noise
Entering a position too early
→ When the speedline has just broken but there is no confirmation yet
Ignoring volume
→ Significantly weakens the signal
Not considering the trend context
→ Leads to misreading the signal
Some important notes
- Always follow the correct order of analysis
- Prioritise signals that are in agreement
- Add indicators such as RSI, MA if needed
- Avoid overtrading when signals are not yet clear
In conclusion
Effective technical analysis does not lie in knowing many tools, but in correctly understanding their order and how they connect with one another. By combining Speed Lines → Internal Trends → Reversal Day → Gap → Island Reversal, investors can build an analytical system that is logical, clear and carries a higher probability in practice.
(!) This article is for informational purposes only and does not constitute investment advice. Readers should conduct their own research or consult a professional before making any financial decisions.



