JAPANESE CANDLESTICK CHARTS
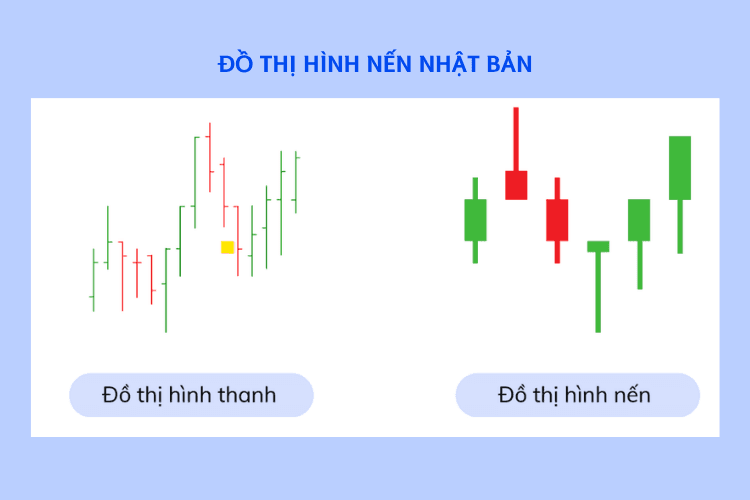
Candlestick charts were invented by the Japanese, based on a principle similar to the bar chart but easier to read.
To draw a candlestick chart from market data, we use the figures already available in the bar chart: the open price, the high price, the low price and the close price.
-
Japanese candlestick charts
Depending on the chart timeframe the investor selects, each candle will represent one trading day/week/month.
The candle body is rectangular and represents the difference between the open and close prices of the day.
The two lines below and above the candle body are called the wicks or shadows. They represent the highest and lowest prices during the trading day.
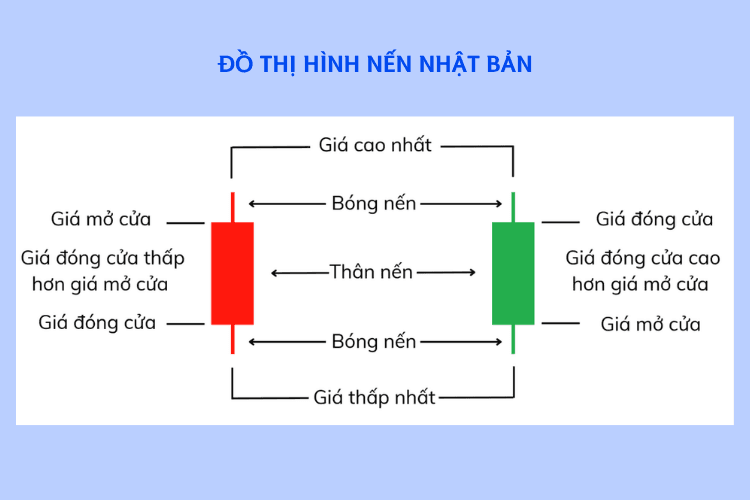
- A red candle body indicates the close price is lower than the open price.
- A green candle body indicates the close price is higher than the open price.
-
Basic candlestick types
Different combinations of body and shadow carry different meanings.
2.1 Long days and short days
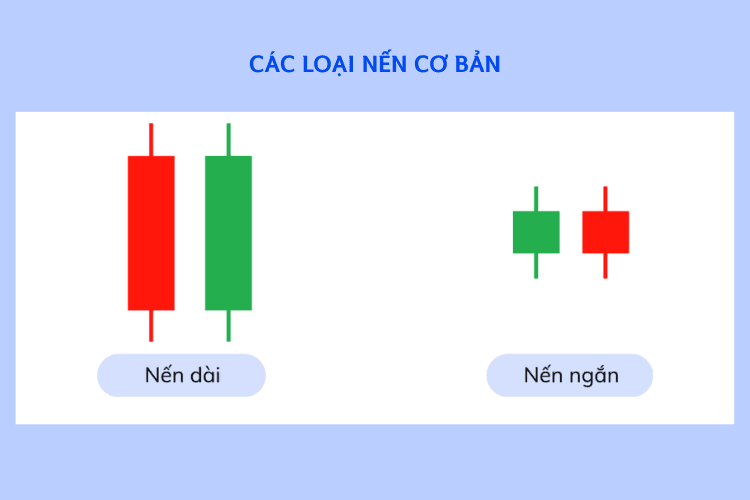
A trading day with a large difference between the open and close prices is called a long day. Similarly, when the difference between the open and close prices is small, it is called a short day.
2.2 Spinning top
A candle with a short body whose upper and lower shadows are longer than the body. The colour of the body is not important in a spinning top. Days with this candle shape are regarded as a tug-of-war, reflecting market indecision.
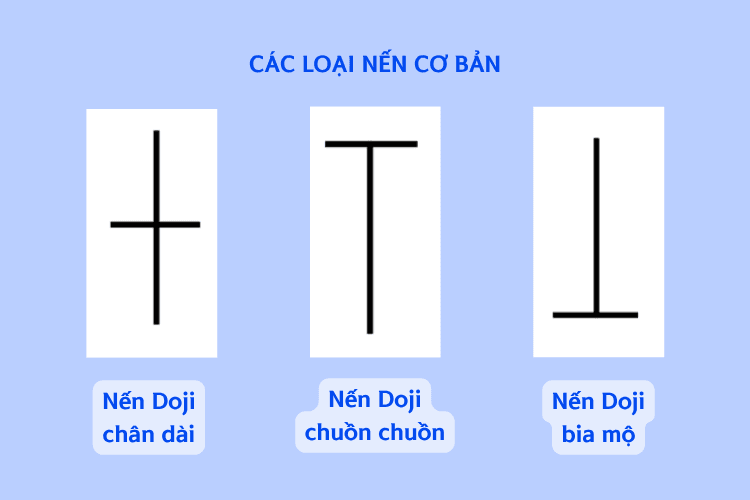
2.3 Doji candles
These appear when the close price is almost equal to the open price. The various types of Doji have shadows of differing lengths.
-
Long-legged Doji
It has both a long upper shadow and a long lower shadow, reflecting the indecision of market participants.
- Dragonfly Doji
It has a long lower shadow and no upper shadow. This is a bullish signal. The candle usually appears at the top of an uptrend or at the end of a downtrend.
- Gravestone Doji
It has a long upper shadow and no lower shadow. The longer the upper shadow, the higher the likelihood of a market decline; it usually appears at the end of an uptrend to signal that market prices are about to fall.
2.4 Marubozu candles
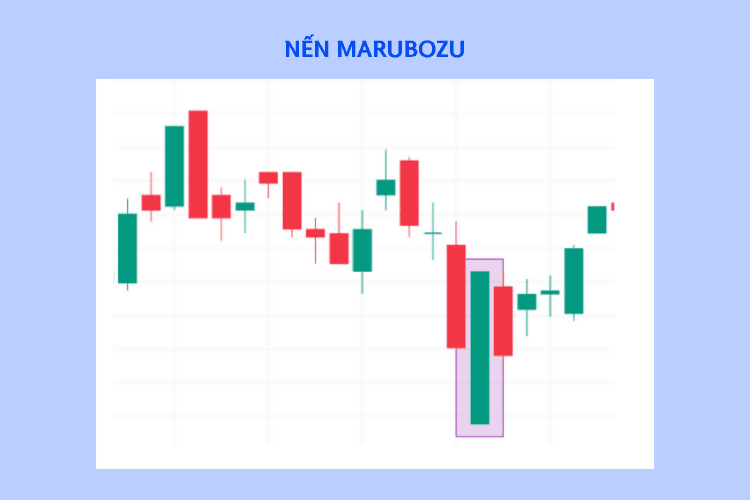
The Marubozu, also known as the power candle, shows the dominance of either buyers or sellers during the trading session. This candle can appear at any stage of the market, signalling trend continuation or trend reversal if it appears at the end of an accumulation/distribution phase.
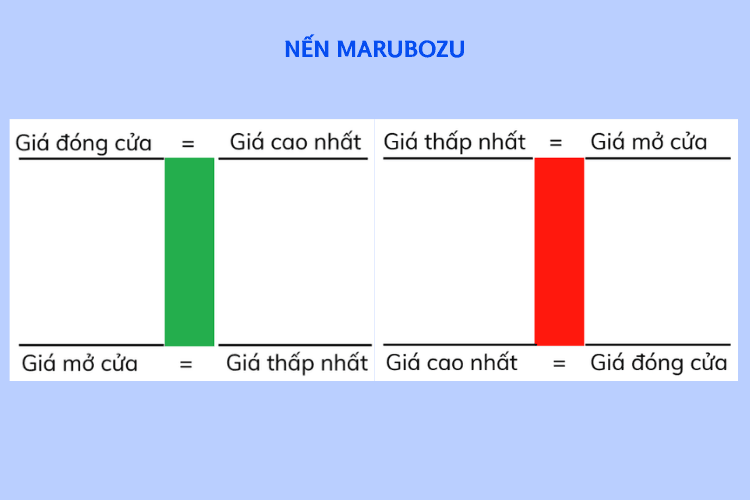
- A green Marubozu shows that buyers are in control of the market, with the highest price equal to the close price and the lowest price equal to the open price.
- A red Marubozu, on the other hand, shows that sellers hold overwhelming dominance in the market, with the highest price equal to the open price and the lowest price equal to the close price.
-
Variations of the bullish Marubozu
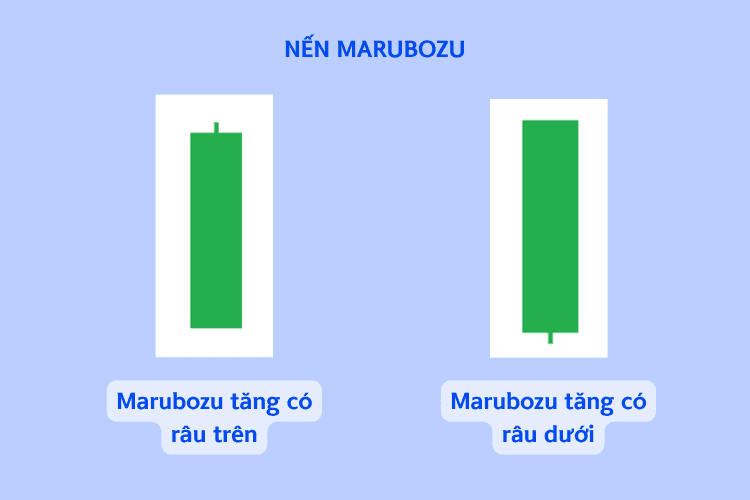
- Bullish Marubozu with an upper wick: This candle has a long body, no lower wick, and an upper wick that is present but very short. This shows that buyers initially had full control of the market, but sellers then stepped in and tried to push prices down, causing the close to settle below the high. Nevertheless, this candlestick pattern still shows that buying pressure remains very strong.
- Bullish Marubozu with a lower wick: This candle has a long body and no upper wick. The lower wick is present but very short, showing that sellers tried to push prices down in the early stage. However, buyers then took control of the situation and successfully drove prices up.
-
Variations of the bearish Marubozu
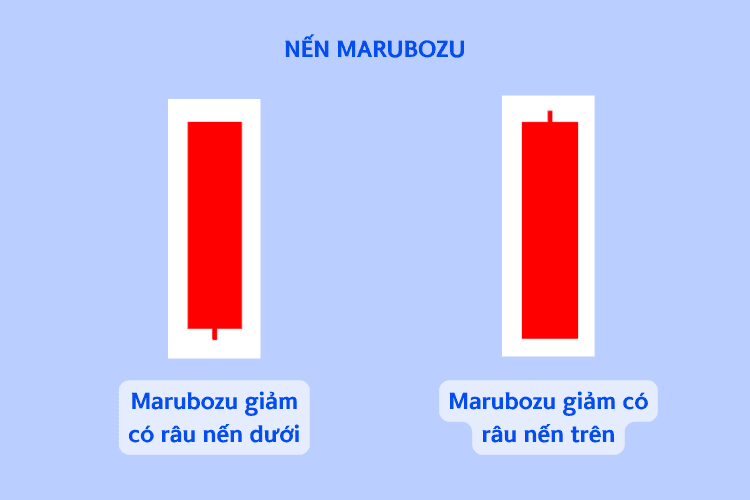
- Bearish Marubozu with a lower wick: There is no wick at the top, and the wick at the bottom is present but very short. This shows that sellers initially held the position but buyers then jumped in, causing the close to settle above the low. Nevertheless, this candlestick pattern still shows that selling pressure remains very strong.
- Bearish Marubozu with an upper wick: This pattern has a long body, no lower wick, and an upper wick that is present but very short. This shows that buyers initially tried to push prices up, but buying pressure was not strong enough. At that point sellers jumped in and took control of the situation, driving prices down, with the close price coinciding with the low price.
We hope that this investment knowledge from Shinhan has helped investors gain a better understanding of the business results report
(!) This article is for informational purposes only and does not constitute investment advice. Readers should conduct their own research or consult an expert before making financial decisions.