

COMMON INDICATORS IN TECHNICAL ANALYSIS - PART 2
-
STOCHASTIC OSCILLATOR (K%D)
The Stochastic oscillator (K%D) compares the closing price with a price range over a given period, thereby reflecting price momentum.
This indicator is made up of 2 components: the %K line and the %D line. Of these, %K is the main line and %D is the 3-session moving average of the %K line.
SOME NOTES
- The most commonly used time frame is 14 sessions. Even so, investors may adjust the time frame as appropriate.
- In addition, this indicator also has 2 boundary lines, 20 and 80, to identify overbought and oversold thresholds.
- The stochastic line can be used on weekly/monthly charts for long-term analysis purposes (determining the direction of the market).
Figure 1: The 14-day stochastic line
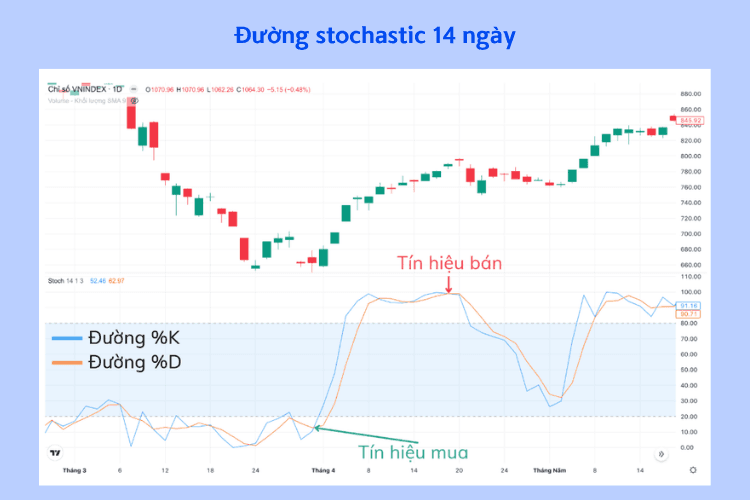
- %K line
- %D line
- Sell signal
- Buy signal
BUY/SELL SIGNALS
- When the %K line crosses below the %D line in the value zone above 80, it is a sell signal.
- When the %K line crosses above the %D line in the value zone below 20, it is a buy signal.
Figure 2: Divergence with the stochastic line
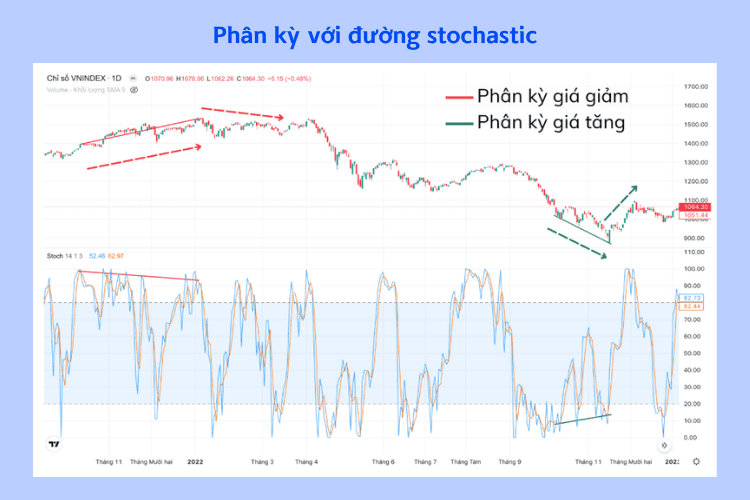
- Bearish divergence
- Bullish divergence
- Bearish divergence appears when the price is trending upward but the later peak of the %D line is lower than the previous peak and is above the 80 zone ⇒ Signals a bearish signal.
- Bullish divergence appears when the price is trending downward but the later trough of the %D line is higher than the previous trough and is below the 20 zone ⇒ Signals a buy signal.
2. LARRY WILLIAMS' %R INDEX
The Williams %R index is used to measure overbought and oversold price levels within the range from -100 to 0.
This indicator can also be used to find market entry and exit points.
How to use
Figure 3: The Williams %R index
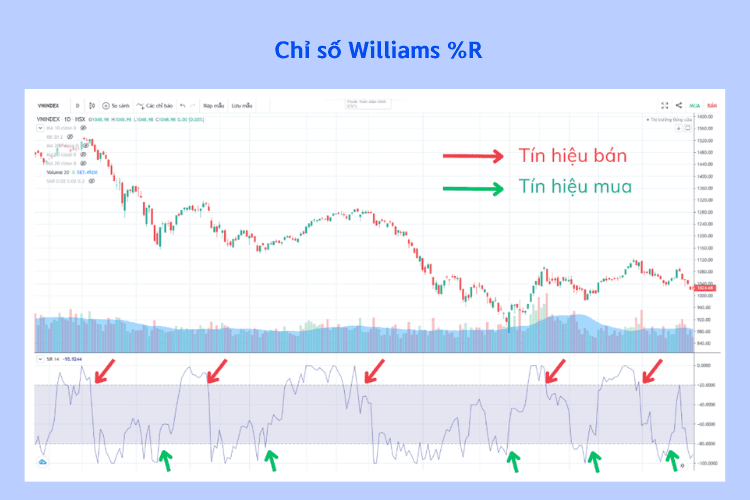
When the Williams %R line is within the range from -20 to 0, the price is at an overbought level.
When the Williams %R line is within the range from -80 to -100, the price is at an oversold level.
3. MOVING AVERAGE CONVERGENCE DIVERGENCE (MACD)
- The MACD line shows the relationship between two exponential moving averages (EMA) of a stock's price.
- The MACD consists of a faster line (the MACD line) and a slower line (the signal line).
- The MACD histogram shows the difference between the MACD line and the signal line.
3.1. Characteristics
Formula for determining the MACD indicator:
MACD line = EMA(12) – EMA(26)
The signal line is the EMA(9) of the MACD line
3.2. How to use
The MACD line crossing above the signal line is a buy signal. The MACD line crossing below the signal line is a sell signal.
The MACD line fluctuating around the 0 line also generates buy and sell signals:
- When the MACD line is very far above the 0 line, it reflects an overbought condition => A sell signal appears.
- When the MACD line is very far below the 0 line, it reflects an oversold condition => A buy signal appears.
Figure 4: The MACD line and the signal line
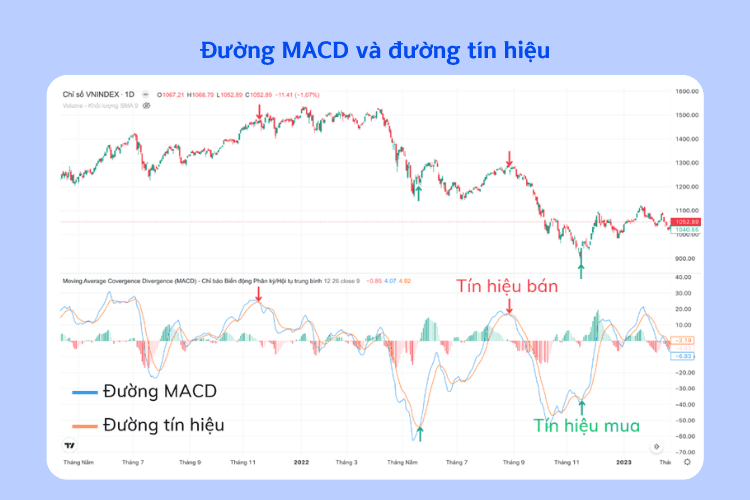
- MACD line
- Signal line
- Sell signal
- Buy signal
Principles:
- The best buy signal is when the MACD line crosses above the signal line and the MACD line is below the 0 line.
- The best sell signal is when the MACD line crosses below the signal line and the MACD line is above the 0 line.
Figure 5: Positive divergence between the MACD line and the price trend
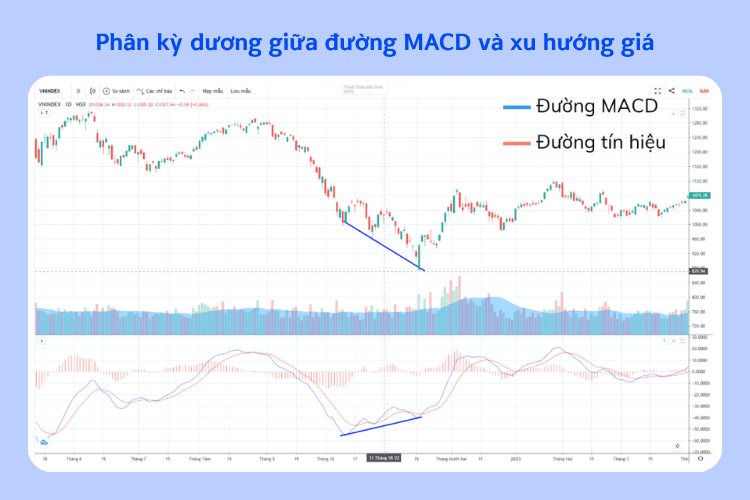
- MACD line
- Signal line
Positive divergence (a bullish reversal sign) appears when the MACD line is below and far from the 0 line. The MACD line forms a later trough higher than the previous trough while the price continues to fall; this creates a divergence signal.
A divergence signal indicates that the current trend is weakening and may reverse in the future.
Figure 6: Negative divergence between the MACD line and the price trend
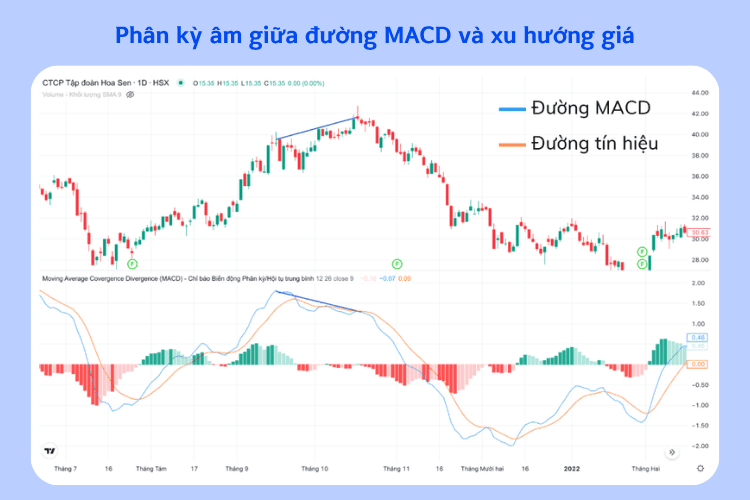
- MACD line
- Signal line
Negative divergence (a bearish reversal sign) appears when the MACD line is above and far from the 0 line. The MACD line forms a later peak lower than the previous peak while the price still continues to rise; this creates a bad divergence signal.
A divergence signal indicates that the current trend is weakening and may reverse in the future.
MACD HISTOGRAM
The MACD histogram shows the distance (narrowing or widening) between the MACD line and the signal line.
The histogram consists of:
- The vertical axis showing the difference between the two MACD lines
- The horizontal axis showing time
- There is a 0 line
How to use (MACD Histogram)
- When the histogram is above the 0 line but starts to decline and crosses below the 0 line
→ The uptrend is weakening ⇒ Sell signal - Conversely, when the histogram is below the 0 line and begins to rise, then crosses above the 0 line
→ The downtrend is weakening ⇒ Buy signal
Figure 7: MACD chart
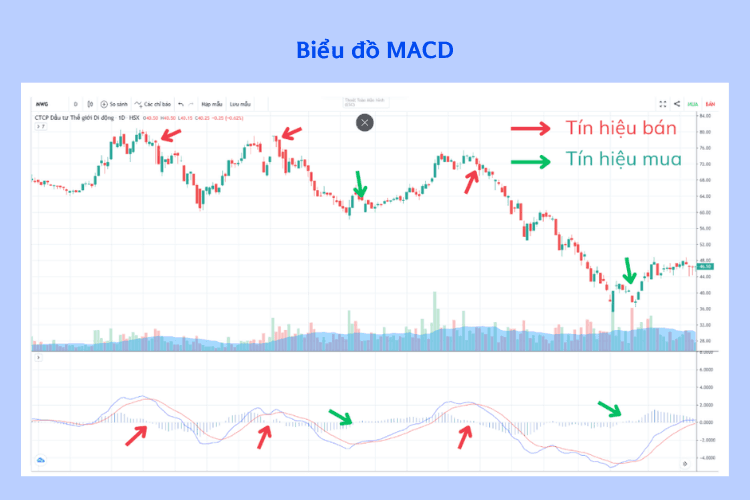
- Sell signal
- Buy signal
(Illustration of entry/exit points based on MACD crossovers and the histogram)
We hope that this investment knowledge from Shinhan has helped investors gain a better understanding of business results reports
(!) This article is for informational purposes only and does not constitute investment advice. Readers should conduct their own research or consult an expert before making financial decisions.



