REVERSAL CANDLESTICK PATTERNS
A reversal candlestick pattern is a combination of candles that signals a trend reversal.
- Bullish reversal candlestick pattern: This pattern appears at the end of a downtrend, signaling that the price will reverse from falling to rising.
- Bearish reversal candlestick pattern: This pattern appears at the end of an uptrend, signaling that the price is about to reverse to the downside.
-
Bullish reversal candlestick patterns
1.1 Hammer candlestick pattern
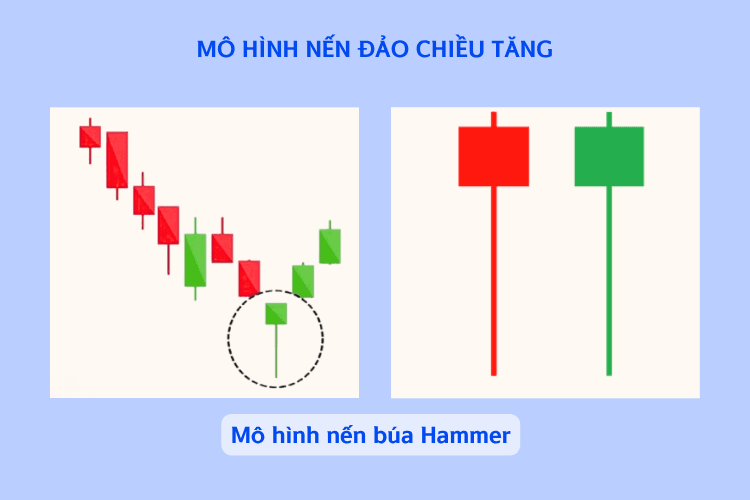
- The Hammer pattern is shaped like a hammer. The candle body is short, the lower shadow is 2-3 times longer than the body, and the upper shadow is usually absent or very short.
- This pattern often appears at the end of a downtrend, forecasting that the market is about to reverse from falling to rising. However, the Hammer candle only takes effect when it is preceded by a series of consecutive red candles.
Note: A bullish Hammer candle (green) gives a stronger reversal signal
and is more reliable than a bearish candle (red candle).
1.2 Inverted Hammer candlestick pattern
The inverted hammer candle has a fairly small body at the bottom, an upper shadow 2-3 times longer than the body, and virtually no lower shadow. The candle may be green or red. However, a green candle gives a stronger reversal signal.
1.3 Bullish Engulfing candlestick pattern
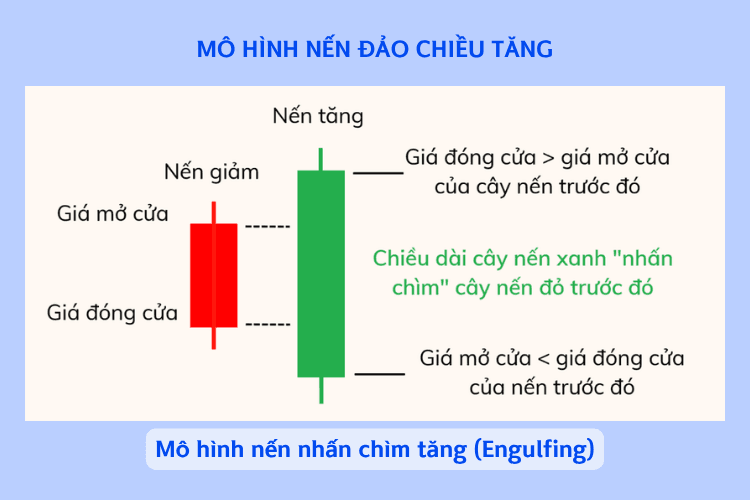
This pattern consists of 2 opposing candles, in which:
- The first candle is a bearish candle. If this candle is a Doji, the reversal signal is even stronger.
- The 2nd candle is a green candle with a large body, larger than the entire first candle.
1.4 The 3 White Soldiers pattern (Three White Soldier)
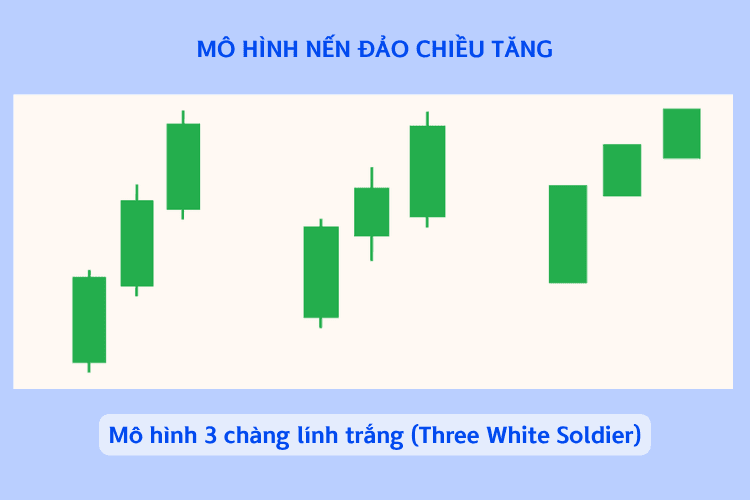
The 3 White Soldiers candlestick pattern (Three White Soldiers) is a cluster of 3 consecutive green candles, in which the opening price of the following candle lies within the body of the preceding candle. This pattern usually appears after a long downtrend or a short sideways period.
1.5 Morning Star pattern
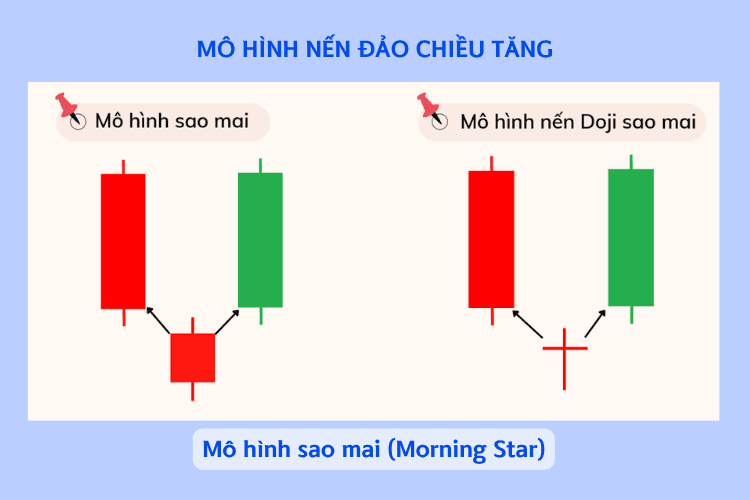
The pattern consists of 3 candles:
- The first candle is a long bearish candle.
- The second candle is a bearish candle, separated by a gap from the initial candle. The pattern gains more reliability if this is a Doji candle.
- The third candle is a bullish candle, with shadows that are not too long.
1.6 Abandoned Baby pattern
- The first candle is a large candle within a downtrend.
- The second candle is a Doji whose opening gaps away from the first candle.
- The third candle is a candle opposite to the first candle with a shadow that is not too long.
-
Bearish reversal candlestick patterns
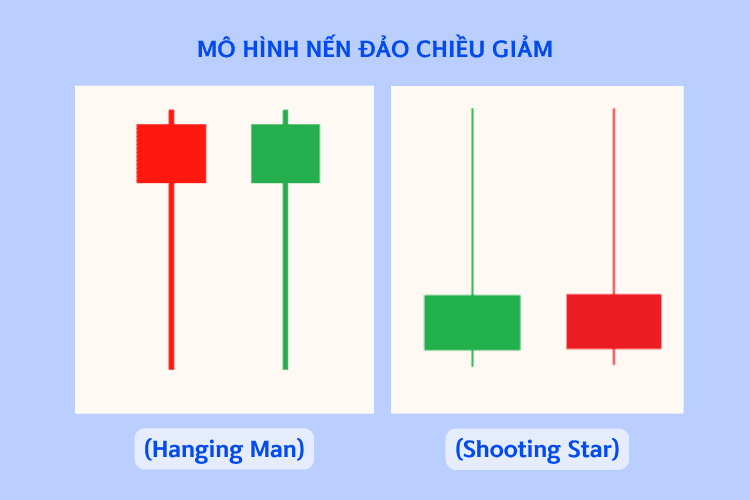
2.1 Hanging Man pattern
The Hanging Man candle has a small body, a lower shadow 2-3 times longer than the body, and an upper shadow that is almost non-existent or very short. The Hanging Man candle looks quite similar to the Hammer candle. However, the Hanging Man candle appears at the end of an uptrend, signalling that market prices are about to fall.
2.2 Shooting Star pattern
The shooting star candlestick pattern has a rather small body, an upper shadow many times longer than the body, and a very short lower shadow. This pattern signals a reversal from an uptrend to a downtrend.
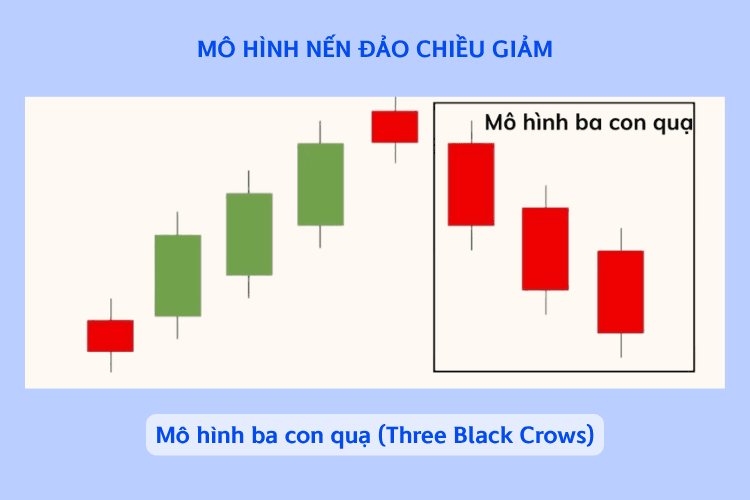
2.3 Three Black Crows pattern
The 3 Black Crows pattern (Three Black Crows) is a formation consisting of 3 consecutive bearish candles, usually appearing at the end of an uptrend and also serving as a signal that the market is entering a bearish phase.
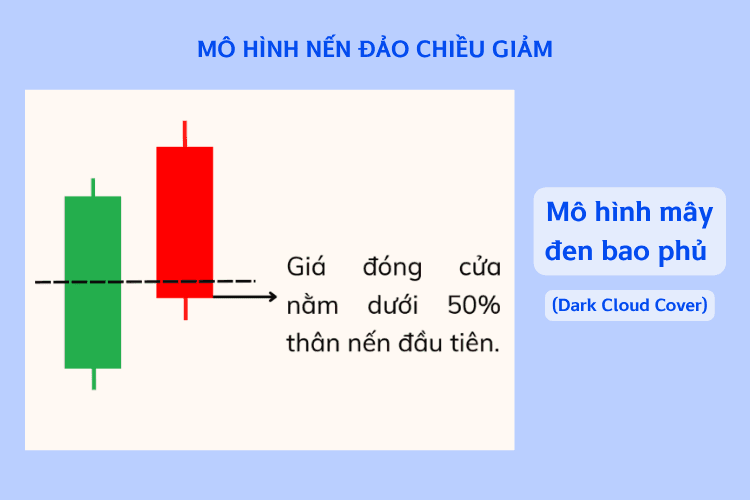
2.4 Dark Cloud Cover pattern
This pattern typically appears at the top of an uptrend, signalling that the uptrend has ended and a reversal is about to take place.
The Dark Cloud Cover candlestick pattern is a cluster of 02 candles with the following characteristics:
- The first candle: A large, strongly bullish candle.
- The second candle: A bearish candle whose closing price lies below 50% of the first candle's body; its opening price does not necessarily have to be above the first candle's closing price.
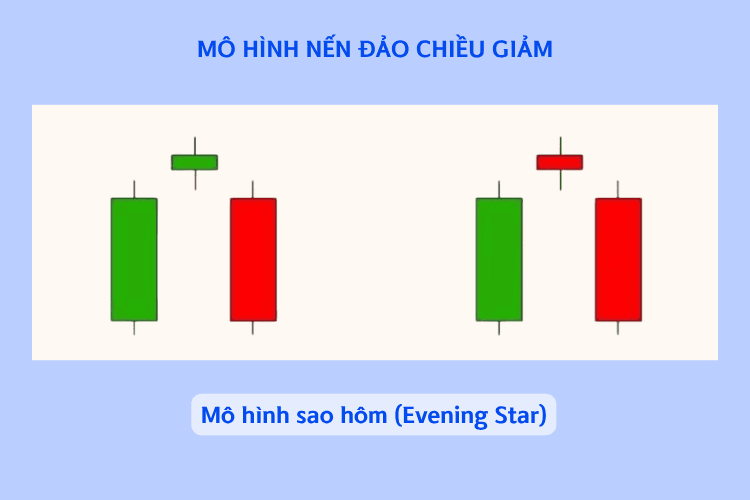
2.5 Evening Star pattern
The pattern consists of 3 candles with the following characteristics:
- The first candle is a strongly bullish candle with a long body, showing that buying pressure is very strong. The longer the candle body, the more accurate the signal given by the Evening Star pattern.
- The 2nd candle has a small body (the closing price is close to the opening price); the colour of the candle does not matter.
- The third candle is a strongly bearish candle with a long body (its length must be at least 1/2 of the first candle's body).
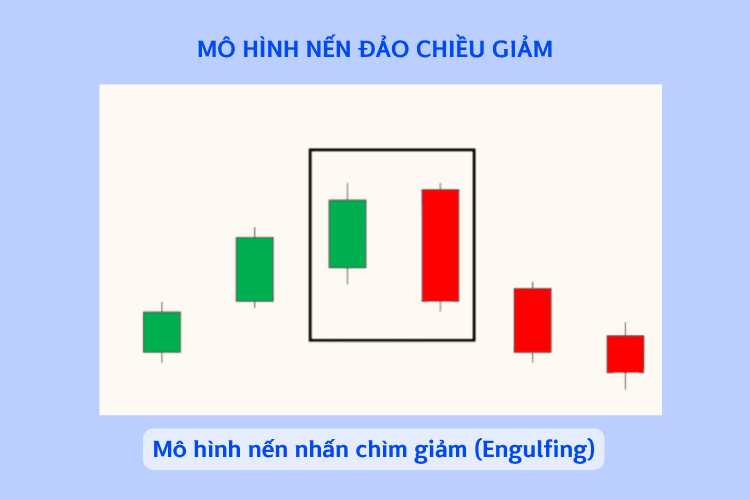
2.6 Bearish Engulfing candlestick pattern
This pattern consists of 2 opposite candles, in which:
- The first candle is a bullish candle. If this candle is a Doji, the reversal signal is even stronger.
- The 2nd candle is a green candle with a large body, larger than the entire first candle.
We hope that the investment knowledge from Shinhan has helped investors gain a better understanding of the business results report
REVERSAL CANDLESTICK PATTERNS

A reversal candlestick pattern is a combination of candles that signals a trend reversal.
- Bullish reversal candlestick pattern: This pattern appears at the end of a downtrend, signalling that the price will reverse from falling to rising.
- Bearish reversal candlestick pattern: this pattern appears at the end of an uptrend, signalling that the price is about to reverse into a decline.
-
Bullish reversal candlestick patterns
1.1 The Hammer candlestick pattern
- The Hammer pattern is shaped like a hammer. The candle body is short, the lower shadow is 2-3 times longer than the body, and the upper shadow is usually absent or very short.
- This pattern usually appears at the end of a downtrend, forecasting that the market is about to reverse from falling to rising. However, the Hammer candle only works when it has been preceded by a series of consecutive red candles.
Note: A bullish Hammer candle (green) gives a stronger reversal signal
and is more reliable than a bearish candle (red candle).
1.2 The Inverted Hammer candlestick pattern
The inverted hammer candle has a fairly small body located at the bottom, an upper shadow 2-3 times longer than the candle body, and almost no lower shadow. The candle may be green or red. However, a green candle gives a stronger reversal signal.
1.3 Bullish Engulfing candlestick pattern
This pattern consists of 2 candles opposite to each other, in which:
- The first candle is a bearish candle. If this candle is a Doji, the reversal signal is even stronger.
- The 2nd candle is a green candle with a large body, larger than the entire first candle.
1.4 The 3 White Soldiers pattern (Three White Soldier)
The Three White Soldiers candlestick pattern is a group of 3 consecutive green candles, in which the opening price of the following candle lies within the body of the preceding candle. This pattern usually appears after a long downtrend or a short sideways period.
1.5 Morning Star pattern
The pattern consists of 3 candles:
- The first candle is a long bearish candle.
- The second candle is a bearish candle, gapping a certain distance away from the first candle. The pattern becomes more reliable if this is a Doji candle.
- The third candle is a bullish candle with shadows that are not too long.
1.6 Abandoned Baby pattern
- The first candle is a large candle within a downtrend.
- The second candle is a Doji with an opening gap that does not overlap the first candle.
- The third candle is a candle opposite to the first candle with a shadow that is not too long.
-
Bearish reversal candlestick patterns
2.1 Hanging Man pattern
The Hanging Man candle has a small body, a lower shadow 2-3 times longer than the body, and an upper shadow that is almost non-existent or very short. The Hanging Man candle looks quite similar to the Hammer candle. However, the Hanging Man candle appears at the end of an uptrend, signalling that market prices are about to fall.
2.2 Shooting Star pattern
The shooting star candlestick pattern has a rather small body, an upper shadow many times longer than the body, and a very short lower shadow. This pattern signals a reversal from an uptrend to a downtrend.
2.3 Three Black Crows pattern
The 3 Black Crows pattern (Three Black Crows) is a formation consisting of 3 consecutive bearish candles, usually appearing at the end of an uptrend and also serving as a signal that the market is entering a bearish phase.
2.4 Dark Cloud Cover pattern
This pattern typically appears at the top of an uptrend, signalling that the uptrend has ended and a reversal is about to take place.
The Dark Cloud Cover candlestick pattern is a cluster of 02 candles with the following characteristics:
- The first candle: A large, strongly bullish candle.
- The second candle: A bearish candle whose closing price lies below 50% of the first candle's body; its opening price does not necessarily have to be above the first candle's closing price.
2.5 Evening Star pattern
The pattern consists of 3 candles with the following characteristics:
- The first candle is a strongly bullish candle with a long body, showing that buying pressure is very strong. The longer the candle body, the more accurate the signal given by the Evening Star pattern.
- The 2nd candle has a small body (the closing price is close to the opening price); the colour of the candle does not matter.
- The third candle is a strongly bearish candle with a long body (its length must be at least 1/2 of the first candle's body).
2.6 Bearish Engulfing candlestick pattern
This pattern consists of 2 opposite candles, in which:
- The first candle is a bullish candle. If this candle is a Doji, the reversal signal is even stronger.
- The 2nd candle is a green candle with a large body, larger than the entire first candle.
We hope that the investment knowledge from Shinhan has helped investors gain a better understanding of the business results report
(!) This article is for informational purposes only and does not constitute investment advice. Readers should conduct their own research or consult a professional before making any financial decisions.