


Trend, support and resistance are key foundations of technical analysis. Correctly understanding these concepts helps investors identify reasonable entry and exit points and read market behaviour.
Quick summary
- Trend helps identify the main direction of price
- Support is a price zone with strong buying pressure
- Resistance is a price zone with strong selling pressure
- Trendline is a popular tool for identifying trends
- Can be combined with price channels and Fibonacci to improve accuracy
What is a trend (Trendline)?
A trend is the main direction in which price moves over a given period of time. A trendline is a straight line connecting the peaks or troughs to identify that trend.
A trendline acts as:
- Support in an uptrend
- Resistance in a downtrend
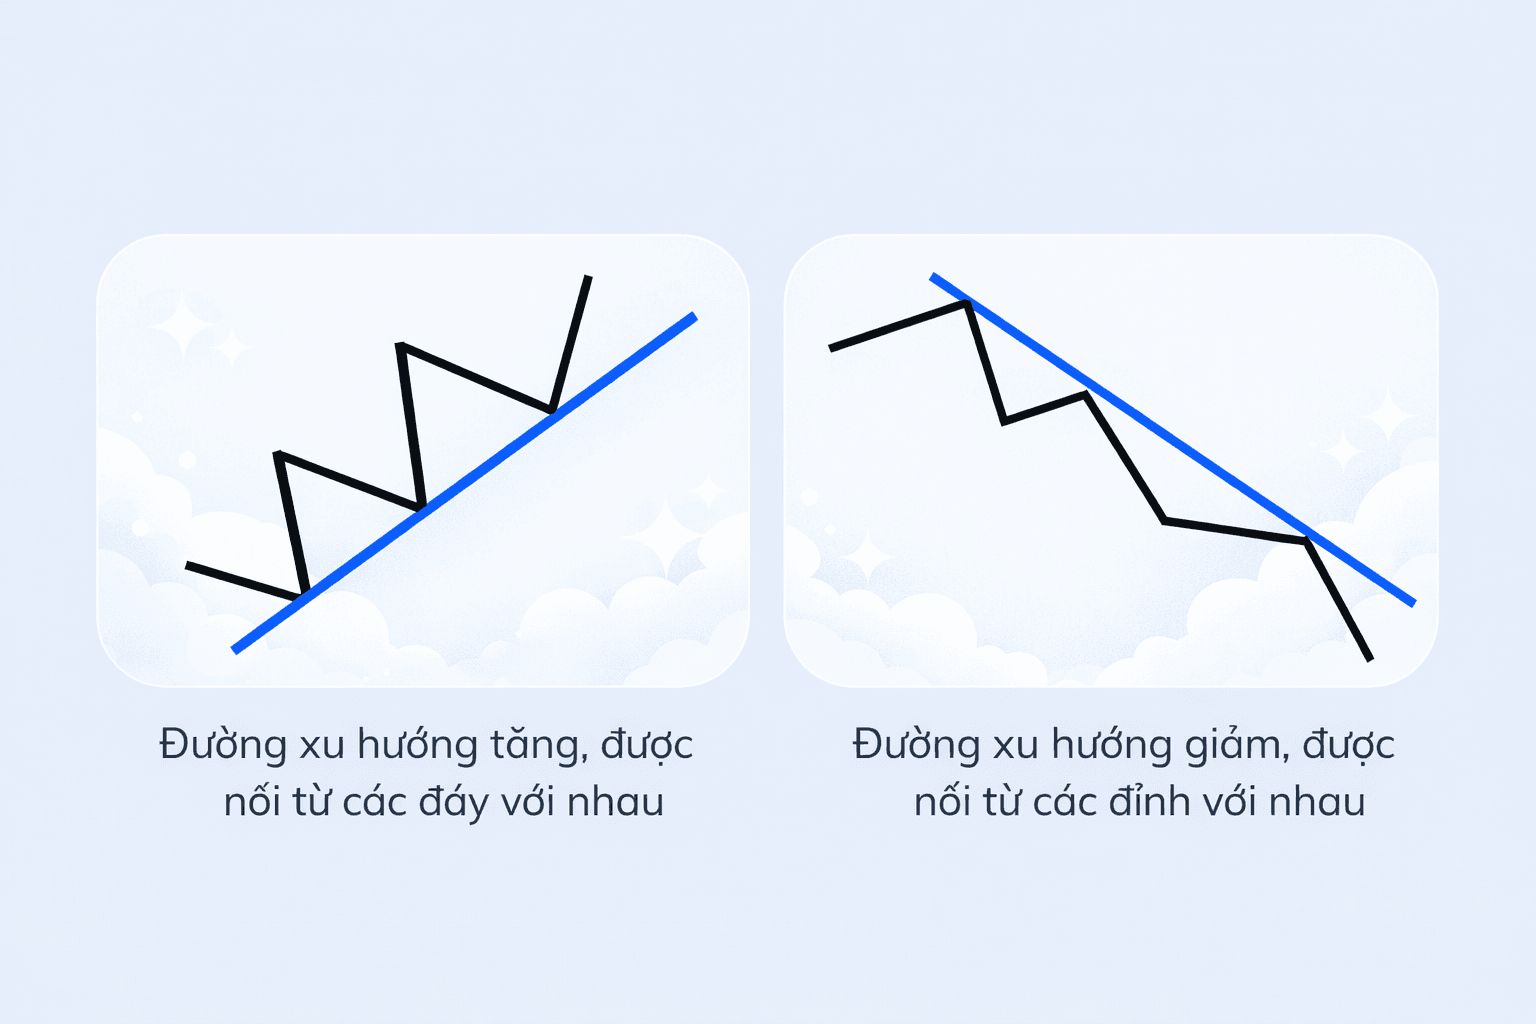
Uptrend and downtrend lines in technical analysis
Types of trends
1. Uptrend
Formed when each subsequent trough is higher than the previous one
2. Downtrend
Formed when each subsequent peak is lower than the previous one
3. Sideways trend
Price fluctuates within a range with no clear trend
How to draw a trendline
To draw an effective trendline, you need to:
- Identify the market's current trend
- Select at least 2 points (peaks or troughs)
- Connect those points to form the trendline
Note:
- Each investor may draw trendlines differently
- The more times a trendline is tested, the more reliable it is
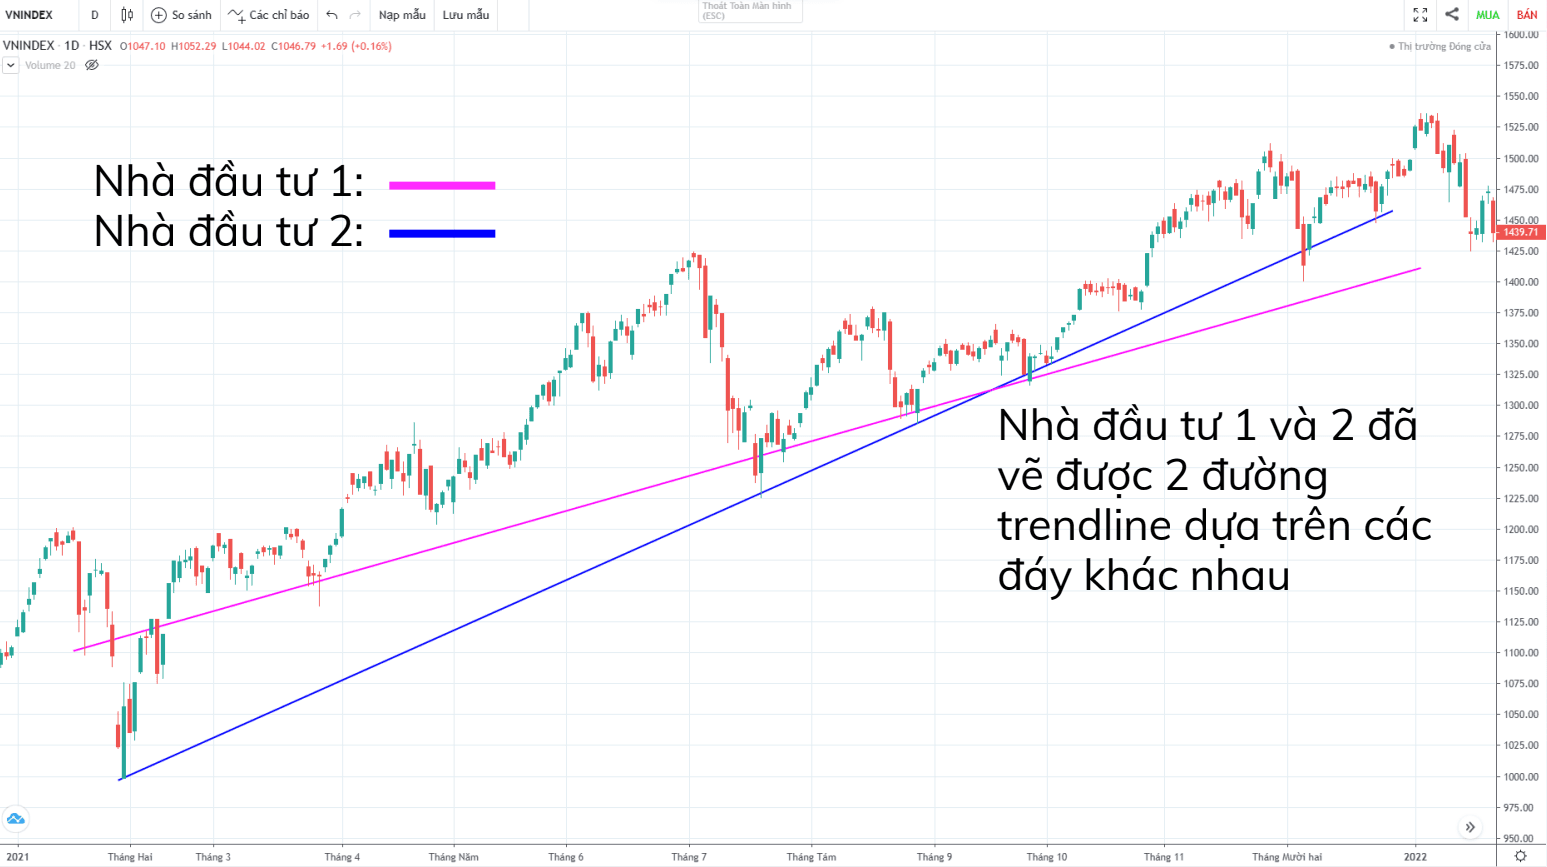
A practical example of drawing a trendline on a price chart
The role of support and resistance
What is support?
A price zone where buying pressure is strong enough to prevent price from falling further
What is resistance?
A price zone where selling pressure is strong enough to prevent price from rising further
Key principles:
- Support can become resistance once broken
- Resistance can become support once broken
How to identify and apply
- When price touches support → consider buying
- When price touches resistance → consider selling
- When a trendline is broken → a new trend may emerge
- Combine with volume to confirm the signal
Points to note when using trendlines
- The more touch points a trendline has, the more reliable it is
- A break is often accompanied by strong volatility
- It is not always possible to draw an accurate trendline
- A trend is not necessarily a perfectly straight line
- The market can be noisy in the short term
The Fan Principle
This principle is based on drawing multiple trendlines from consecutive troughs or peaks.
How to interpret it:
- When the trend weakens → price will break each trendline in turn
- Breaking the 2nd or 3rd trendline → a strong reversal signal
Significance:
- Helps identify trend changes early
- Improves accuracy when multiple lines are combined
The fan principle in trend analysis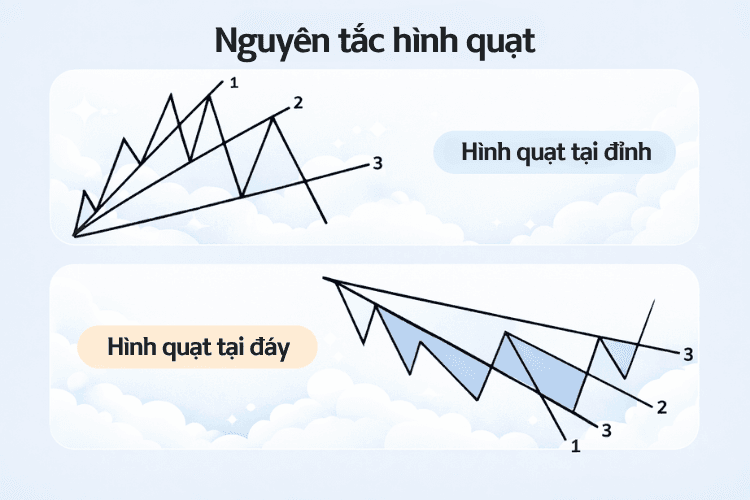
Channel line
A price channel is created by:
- Connecting the peaks → creating resistance
- Connecting the troughs → creating support
Two parallel lines form the price channel
Application:
a. Price touches the upper line → selling zone
b. Price touches the lower line → buying zone
c. Price breaks the channel → a strong signal
Fibonacci Retracement
Fibonacci helps identify price zones likely to reverse during a correction.
Common levels:
- 38.2%
- 50%
- 61.8%
Example:
A strongly rising stock will often correct back to these levels before continuing its trend.
Significance:
- Identifies reasonable buying zones in an uptrend
- Identifies selling zones in a downtrend
Illustrative example (optional)
A stock in an uptrend that corrects to the 50% Fibonacci zone and rebounds → confirms the trend continues.
Notes and mistakes
- Drawing trendlines too subjectively
- Not waiting for confirmation of a break
- Using a single tool only
- Ignoring broader market factors
Conclusion
Correctly understanding trend, support and resistance helps improve your ability to read the market and optimise entry points.
(!) This content is provided for educational purposes and is not an investment recommendation.



