

What Are Trends, Support and Resistance? Understanding Them Correctly for Effective Trading
In the stock market, prices do not move randomly but always follow certain patterns. Identifying trends, support and resistance levels helps investors understand cash flow behaviour and make sounder decisions.
Quick summary
- A trend is how the market moves through successive peaks and troughs
- There are 3 main types of trend: uptrend, downtrend and sideways
- Support is a price zone with strong buying pressure; resistance is a zone with heavy selling pressure
- Trends help determine strategy: buy - sell - stay out
- Support and resistance can reverse roles once broken
Definition of a trend in technical analysis
A trend is the direction in which the market moves, formed by a series of zigzag fluctuations resembling successive waves with clear peaks and troughs.
Types of trends
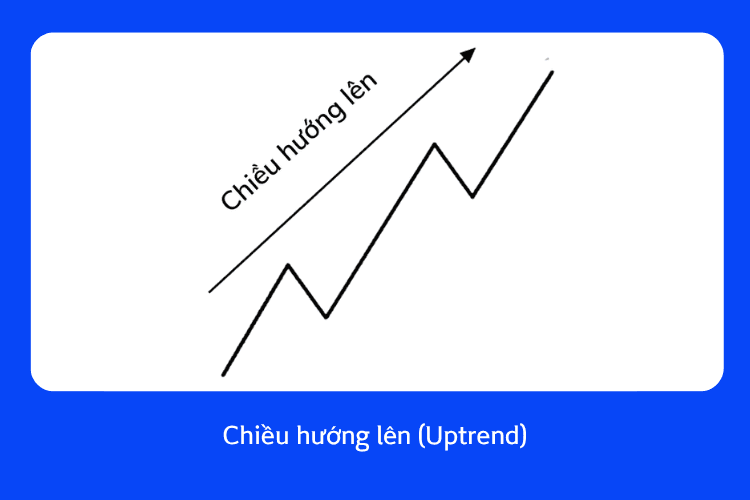
1. Uptrend
An uptrend is identified when:
- Each peak is higher than the previous peak
- Each trough is higher than the previous trough
This reflects cash flow leaning towards the buy side and positive market sentiment.
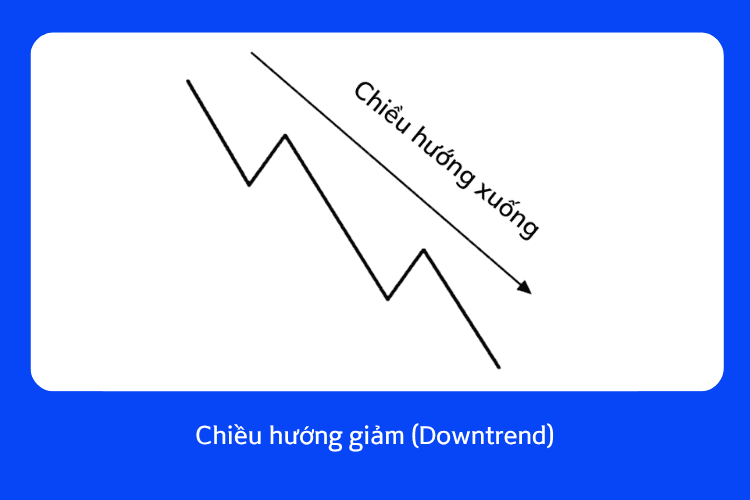
2. Downtrend
A downtrend has the following characteristics:
- Each peak is lower than the previous peak
- Each trough is lower than the previous trough
This signals that selling pressure dominates the market.
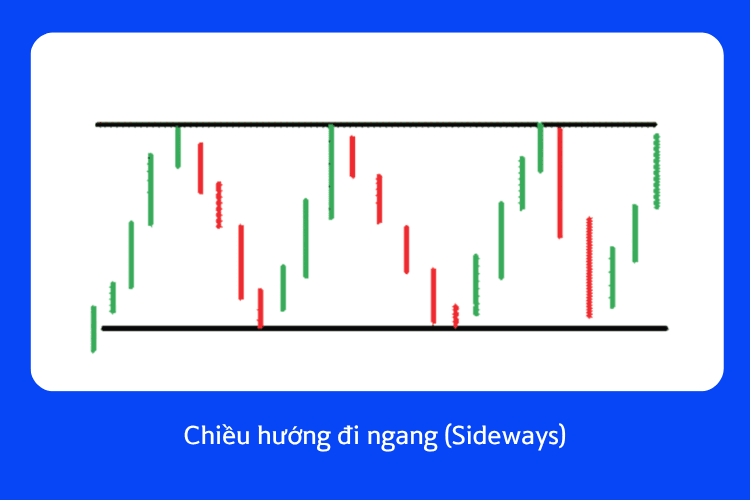
3. Sideways trend
A sideways trend occurs when:
- Each peak is roughly equal to the previous peak
- Each trough is roughly equal to the previous trough
At this point the market is in a tug-of-war between buyers and sellers.
Classification by time frame (Dow Theory)
According to Dow Theory, trends are divided into 3 levels:
- Primary trend
A long-term trend lasting more than 1 year - Intermediate trend
Lasting from a few weeks to a few months - Short-term trend
Occurring over a short period of less than 2–3 weeks
How to identify and apply trends
Principles of acting on the trend
- Rising market: prioritise buying
- Falling market: prioritise selling
- Sideways market: limit trading
Practical application
In a medium-term uptrend:
- Short-term corrections are often buying opportunities
- Prices will continue to rise as long as the trend structure is not broken
Support and resistance levels
1. What is a support level?
Support is a price zone where:
- Buying pressure is stronger than selling pressure
- Prices usually stop falling and rebound
It is usually identified by previous troughs
2. What is a resistance level?
Resistance is a zone where:
- Selling pressure is greater than buying pressure
- Prices usually struggle to move higher
It is usually formed from previous peaks
Common mistakes
- Not every support/resistance level is absolutely accurate
- They should be regarded as price zones, not a fixed price level
- When strongly broken, support can become resistance and vice versa
- Round price levels such as 10, 20, 100 are often psychological support/resistance
Conclusion
Correctly understanding trends and support - resistance zones not only helps you read the market better but is also an important foundation for building an effective and disciplined trading strategy.
* Disclaimer: This article is for informational purposes only and does not constitute investment advice. Readers should conduct their own research or consult an expert before making financial decisions.



