

What is a continuation pattern? Identification and application in trading

In the course of market movement, prices do not always rise or fall continuously. There are phases of "pausing to gather momentum" before the previous trend resumes – and that is exactly when continuation patterns appear.
Correctly understanding these patterns helps investors avoid "signal noise" and make good use of entry points.
Quick summary
- A continuation pattern is a temporary accumulation zone before the trend continues
- Common groups include: triangles, flags, wedges, rectangles
- Price usually converges and breaks out to confirm the trend
- Trading volume plays an important confirming role
- Suitable for finding entry points in line with the trend
Definition of a continuation pattern
A continuation pattern is a form of sideways price movement, reflecting a pause in the preceding trend before returning to the original trend.
Typically, these patterns appear over the short to medium term and act as the market's "resting point".
Classification of continuation patterns
1. Triangle patterns
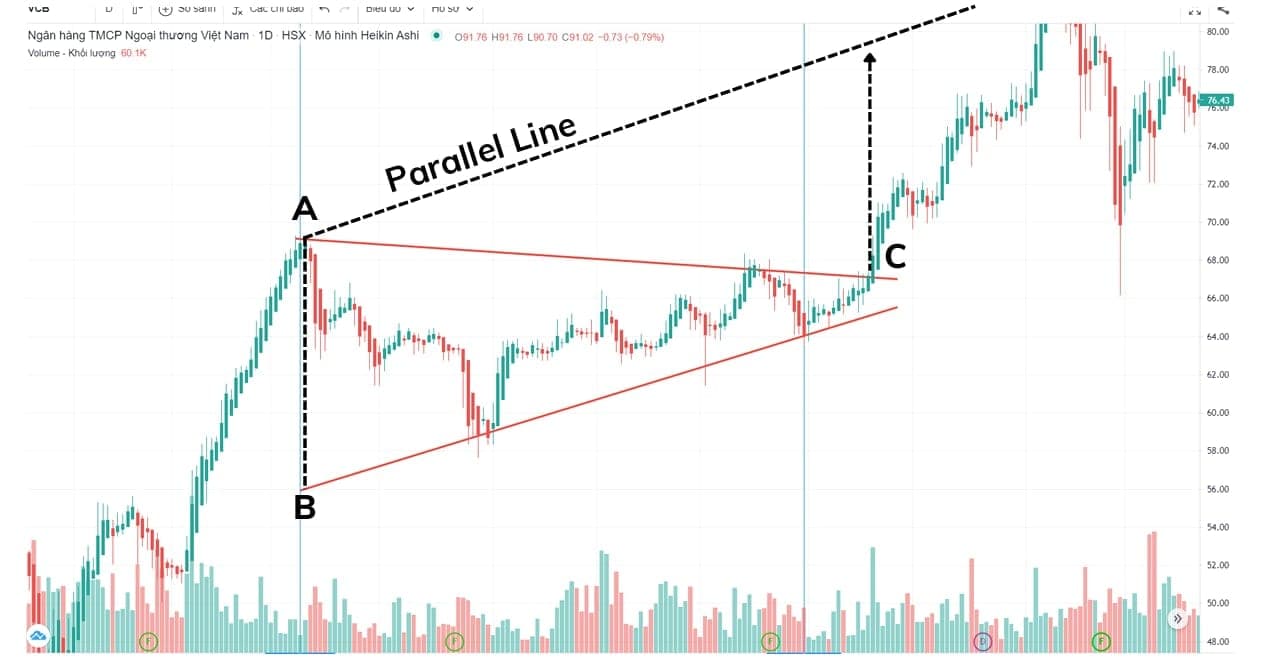
a. Symmetrical triangle
- Formed by 2 converging trendlines
- Price fluctuations narrow gradually
- Trading volume declines over time
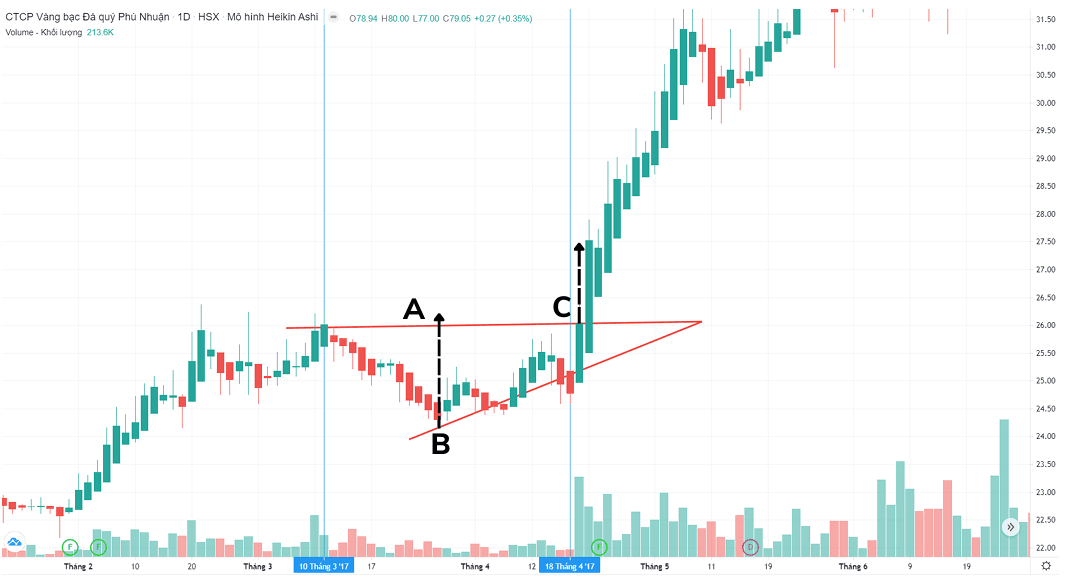
b. Ascending triangle
- The lower side slopes upward, the upper side is nearly horizontal
- Reflects buying pressure building up
- The breakout usually goes upward
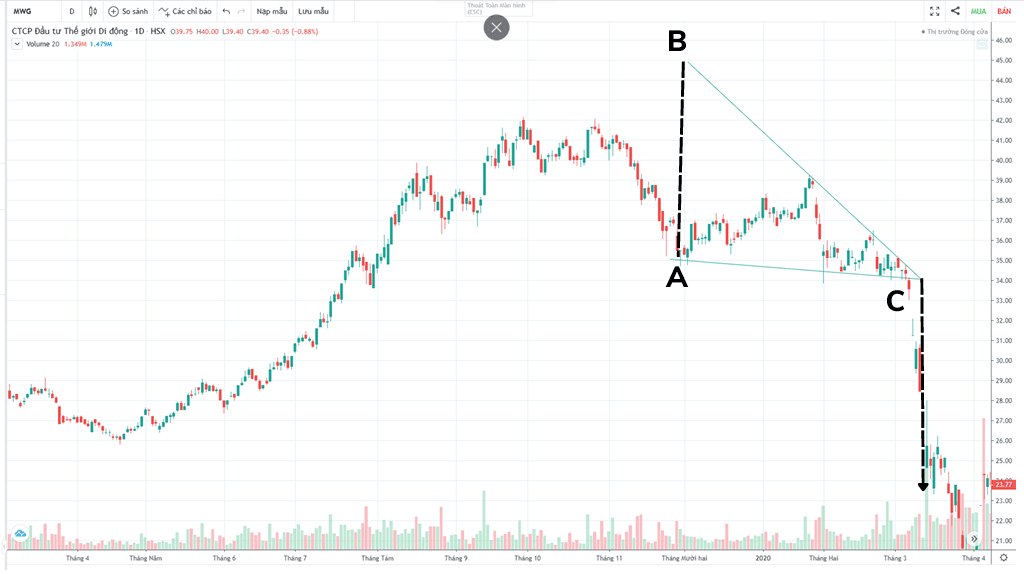
c. Descending triangle
- The upper side slopes downward, the lower side is nearly horizontal
- Reflects increasing selling pressure
- The breakout usually goes downward
Note:
The symmetrical triangle is neutral in nature; it is necessary to observe the preceding trend to determine the breakout direction.
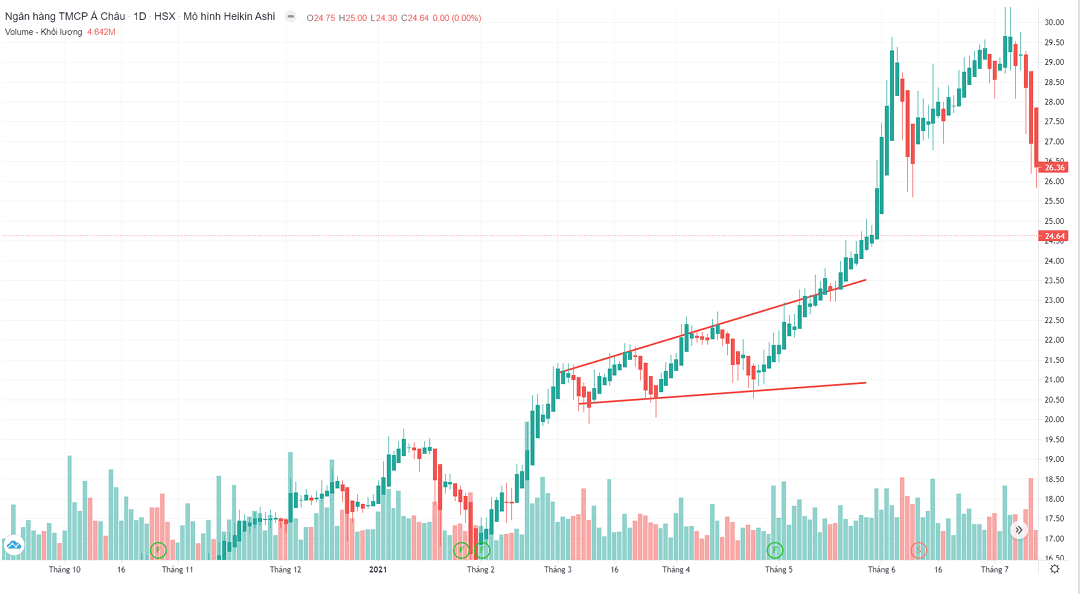
2. Broadening triangle pattern
- The price range grows increasingly wider
- Higher highs but lower lows
- Reflects unstable market sentiment
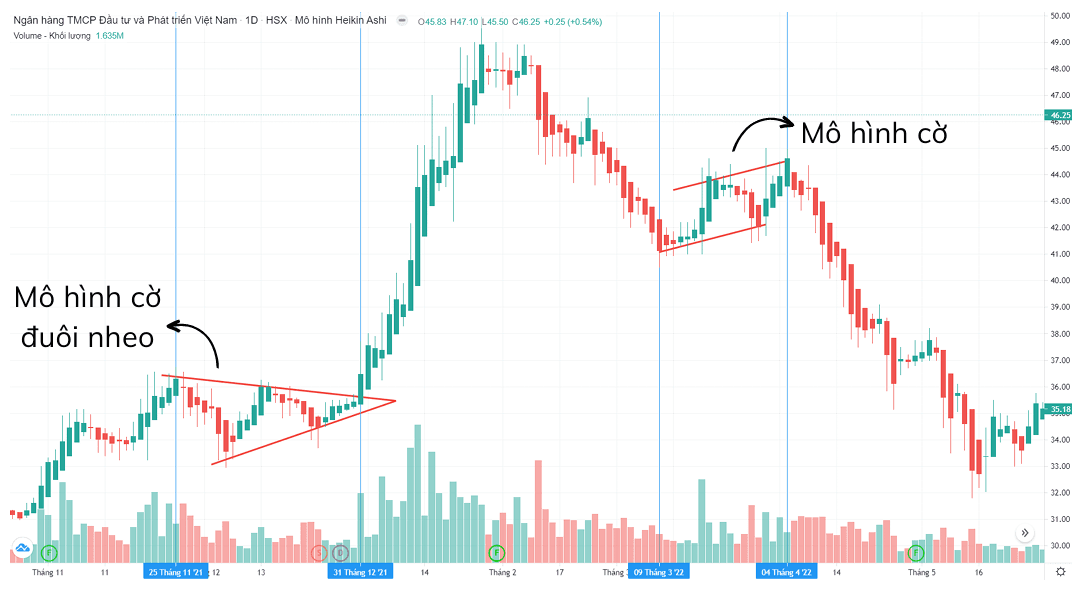
3. Flag and pennant patterns
- Flag pattern
- Rectangular or parallelogram shaped
- Two parallel trendlines
- Slopes against the preceding trend
- Pennant pattern
- Small triangle shaped
- Two converging lines
Common characteristics:
- Appears after a strong up/down move
- Short formation time (1–3 weeks)
- Volume declines during the accumulation process
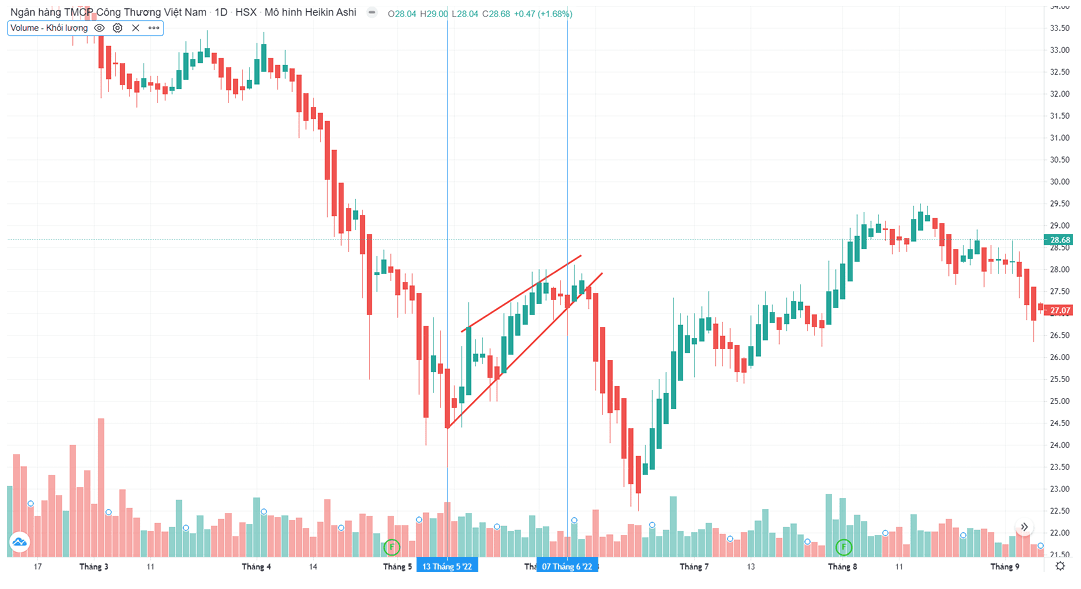
4. Wedge pattern
- Two converging trendlines
- Opposite in direction to the preceding trend
- When a breakout occurs, the old trend continues
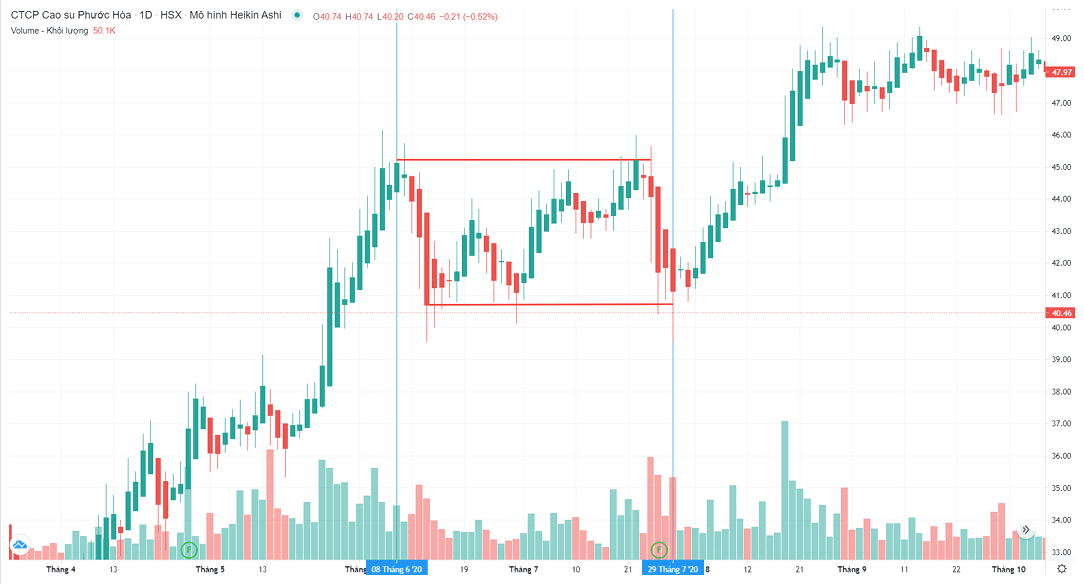
5. Rectangle pattern
- Price moves sideways within a fixed range
- Two parallel support and resistance lines
- The breakout confirms the trend
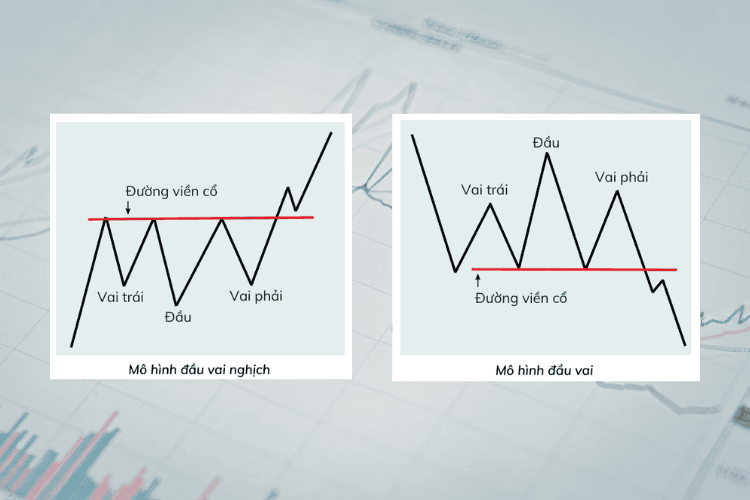
6. Head and shoulders continuation pattern
- May appear as a continuation pattern
- Head and shoulders: continuation of a downtrend
- Inverse head and shoulders: continuation of an uptrend
How to identify and apply
How to identify
- Appears after a clear trend
- Price moves sideways or converges
- Volume declines gradually
- Breakout accompanied by confirming volume
How to apply
- Wait for the breakout to enter in line with the trend
- Prioritise trading in line with the preceding trend
- Combine with support – resistance to increase the probability
Common mistakes
- Entering too early before the breakout
- Ignoring the volume factor
- Confusing continuation patterns with reversal patterns
- Not considering the preceding trend
Conclusion
Continuation patterns not only help in understanding market structure clearly but are also an important tool for optimising trend-following entry points – a core element of effective trading.
(!) This article is for informational purposes only and does not constitute investment advice. Readers should do their own research or consult an expert before making financial decisions.



