

What is a reversal pattern? How to identify and apply it effectively

The reversal pattern is an important tool that helps investors identify the moment a price trend changes. Correctly understanding and accurately applying this pattern will improve the ability to determine buy and sell points in the market.
1. Quick summary of the reversal pattern
(1) Forecasts the reversal of the current price trend
(2) Usually appears at the end of an uptrend or a downtrend
(3) Trading volume plays a role in confirming the signal
(4) Helps determine effective entry and exit points
(5) Is an important foundation in technical analysis
2. What is a reversal pattern?
A reversal pattern is a form of price chart showing that the current trend is likely to end and switch to the opposite trend.
Simply put:
I. Uptrend → may switch to a downtrend
II. Downtrend → may switch to an uptrend
Trading volume is usually used to confirm the reliability of the pattern.
3. Characteristics of the reversal pattern
The important characteristics include:
(1) The preceding trend must be clear
→ No trend means no reversal
(2) The first signal is a break of the main trend
→ Break of the trendline or of the support/resistance zone
(3) The formation time varies
- Top patterns: form quickly, with strong volatility
- Bottom patterns: form more slowly
(4) The larger the size of the pattern → the stronger the subsequent movement
(5) Trading volume plays a confirming role
→ Especially important in an uptrend
4. Common types of reversal patterns
The main types include:
(1) Head and shoulders pattern
(2) 2 tops – 2 bottoms pattern
(3) 3 tops – 3 bottoms pattern
(4) Rounding (saucer) pattern
(5) Spike pattern
5. Head and shoulders pattern[1]
The head and shoulders pattern signals a trend shifting from up to down.
The structure includes:
- Left shoulder
- Head (the highest top)
- Right shoulder
- Neckline
Characteristics:
(1) The head is higher than the two shoulders
(2) The price breaks the neckline → confirming the reversal
(3) Volume declines gradually at the right shoulder and rises sharply upon the break
6. How to determine the price target
Calculation method:
Price target = Price at the breakout point – Height of the pattern
In which:
- Height = the distance from the head to the neckline
7. Illustrative example
A practical example:
- Head: 35,540
- Neckline: 31,640
→ Height = 3,900
→ Target price ≈ 27,460
Note:
- This is the minimum target
- The price may exceed it or fall short of it depending on the market
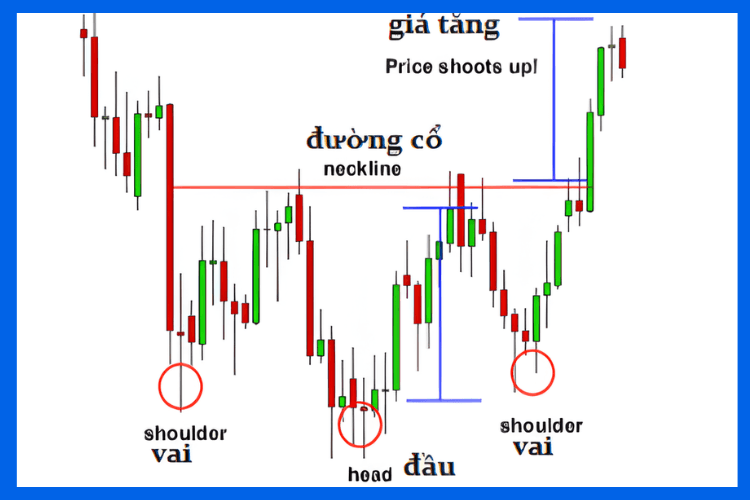
8. Inverse head and shoulders pattern
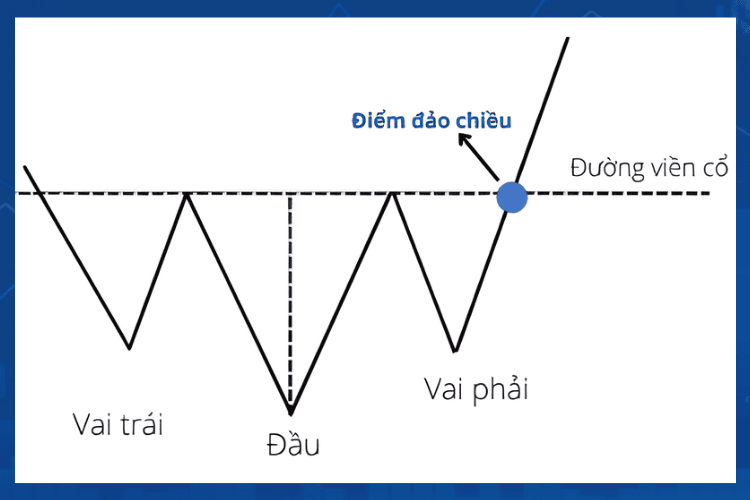
This is the reversed version of the head and shoulders pattern.
Characteristics:
(1) Appears in a downtrend
(2) Signals a reversal to an uptrend
(3) The head is the lowest bottom
Applicable strategy:
- Buy when the price breaks the neckline
- Prioritise when there is volume confirmation
9. The 2 tops and 2 bottoms patterns
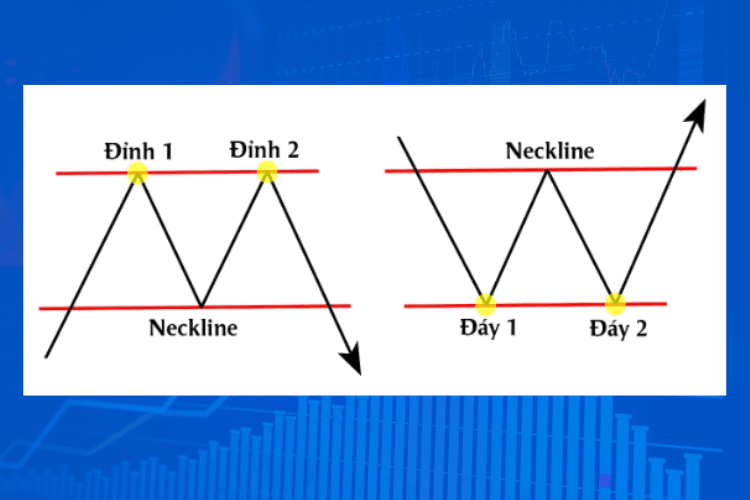
9.1. The 2 tops pattern
(1) Appears in an uptrend
(2) M shape
(3) The price fails to break resistance → downward reversal
9.2. The 2 bottoms pattern
(1) Appears in a downtrend
(2) W shape
(3) The price rebounds from support → upward reversal
10. The 3 tops and 3 bottoms patterns
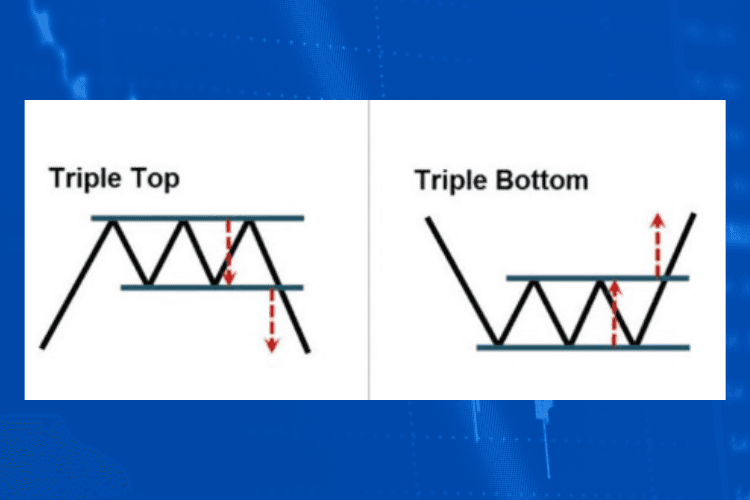
(1) The 3 tops pattern → downward reversal
(2) The 3 bottoms pattern → upward reversal
Characteristics:
- Higher reliability than the 2 tops/bottoms pattern
- A break of the neckline is needed for confirmation
11. The saucer pattern and the spike pattern
11.1. The saucer pattern
- Appears slowly
- The price forms a rounded bottom
- Reverses gradually
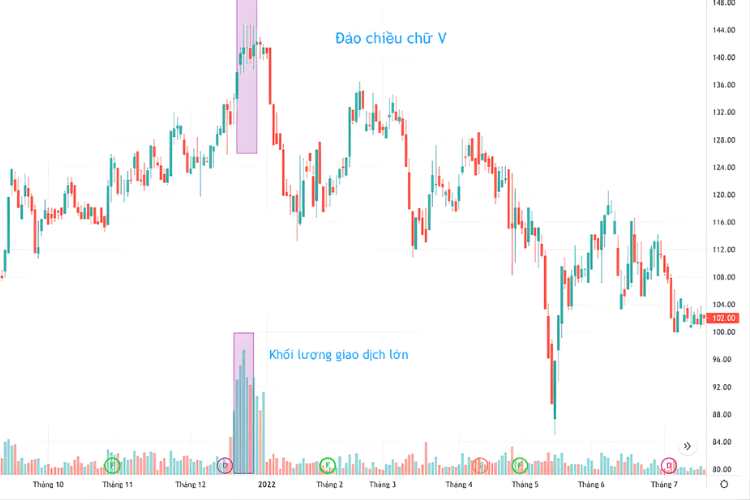
11.2. The spike pattern
- Appears quickly
- Strong volatility
- Usually caused by unexpected news
12. Common mistakes
(1) Identifying a pattern when there is no clear trend yet
(2) Entering an order before there is breakout confirmation
(3) Ignoring the volume factor
(4) Misunderstanding the 2 tops/bottoms pattern
Summary
The reversal pattern is an important tool that helps investors identify market reversal points and optimise their trading strategy.
(!) This article is for reference only


