
This guide to technical analysis in stock trading will help investors and newcomers to the stock market grasp the fundamentals. From there, they can master their own approach and easily make the most important decisions. If so, join Shinhan Securities Vietnam in exploring the details in the article below!
-
What is technical analysis in stock trading?
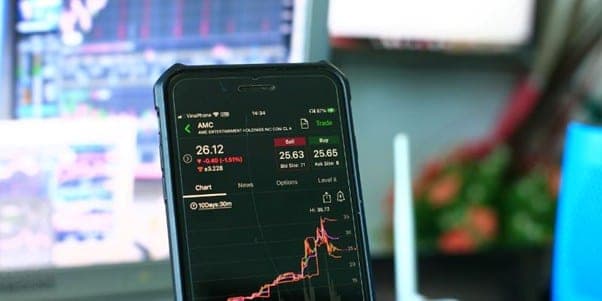
Technical analysis in stock trading is the process of using related data, charts and graphs to assess the fluctuations between the supply and demand of a stock or a group of stocks. Based on this analysis, investors can forecast the future potential of prices and thereby decide whether to buy or sell.
Technical analysis in stock trading
-
Benefits of technical analysis in stock trading
Learning technical analysis in stock trading helps investors make accurate investment decisions in stocks. This is because technical analysis has the following three important functions:
- Alerting to price changes: Technical analysis helps investors recognise changes in prices. From there, they can sell their shares to stay safe and establish new safety thresholds.
- Providing assessments and confirming new price trends: Technical analysis helps investors assess and confirm new price trends of a stock. This allows them to build strategic investment plans over the short, medium and long term.
- Forecasting future prices: Technical analysis relies on past price levels and market trends to forecast future prices. This helps investors make sound investment decisions.
Benefits of technical analysis in stock trading
-
A guide to technical analysis in stock trading using charts
If you are just starting to learn about this method, you can refer to the analysis guide below:
3.1. The tool area
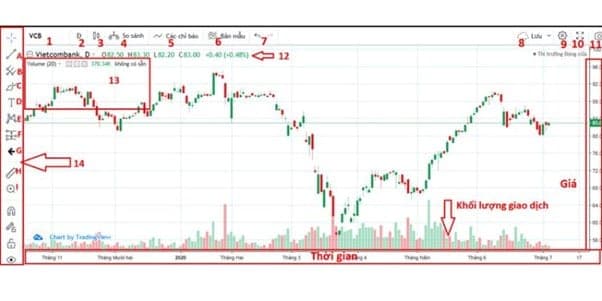
The interface of a stock chart is divided into 1 vertical axis and 1 horizontal axis. The corresponding tools for each area of the chart are as follows:
- 1: Enter the ticker symbol you want to analyse
- 2: Analysis timeframe, which can be changed from 1 minute to 1 month and uses the following characters:
- D: Intraday timeframe
- W: Weekly timeframe
- M: Monthly timeframe
- 3: Select the chart type: Choose the chart suited to price developments. The two most widely used models are the short-term development model and the long-term development model.
- 4: Compare the current stock with another stock
- 5: Stock analysis indicators; you should not use more than 4 indicators on 1 stock chart.
- 6: Save a chart template, retaining the trading settings you have configured
- 7: Undo and Redo
- 8: Save the chart
- 9: Chart settings
- 10: Full-screen view mode
- 11: Take a screenshot
- 12: Basic information on the stock: opening – closing price, highest – lowest price
- 13: The area consolidating all indicators
- 14: The support toolbar, including the following tools:
- A: Trend drawing tool
- B: Pattern drawing tool
- C: Marking tool
- D: Text typing tool
- E: Tool for drawing analysis templates
- F: Price range measurement tool
- G: Insert icons onto the chart
- H: Tool for measuring the number of advances, the extent of increases and decreases, etc.
- I: Zoom out, zoom in
In addition, the chart also contains a number of important symbols such as:
- O (Open): Opening price
- H (High): Highest price
- L (Low): Lowest price
- C (Close): Closing price
A detailed guide to technical analysis in stock trading
3.2. The price movement area
Price movements are displayed in candlestick form, with each day's share price represented by 1 candle. The longer the candle, the greater the price movement between the opening price and the closing price. A line appearing above the candle body indicates the highest price of the session; conversely, a line below indicates the lowest price of the session.
Candles come in 2 colours: green and red. The candle colours are understood as follows:
- Green: The price is higher than the opening price
- Red: The price is lower than the opening price
3.3. The trading volume area
The trading volume area tells you how many people are buying and selling the stock, allowing you to gauge the sentiment of other investors. If trading volume is low, it means investors do not want to trade or the market is illiquid.

The trading volume area
-
Reliable securities trading at Shinhan Securities Vietnam (SSV)
Shinhan Securities is a reputable securities company with many years of operating experience in Vietnam. The company provides online securities trading software that is safe, convenient and easy to use, with many features suited to a wide range of investor types:.
- Prestige and reliability: Shinhan Securities Vietnam is one of the leading and most reputable securities trading companies in the financial sector. This builds strong trust from customers and investors, helping them feel secure when choosing Shinhan Securities Vietnam (SSV) as their trading partner.
- Diverse and professional services: Shinhan Securities Vietnam provides a wide range of high-quality securities trading and investment advisory services, including online trading, investment advisory for individuals and businesses, asset management, and market research.
- Advanced and innovative technology: SSV continuously invests in advanced and innovative technology to deliver the best trading experience to customers.

Trade securities at SSV today
In the article above, SSV has provided the most detailed guide to technical analysis in securities for readers. We hope this will be useful information and a foundation for investors who are just starting out in the stock market!



