

Technical analysis charts in securities are one of the securities analysis methods investors use to build their strategies. So what forms do these charts usually take, and how do you read a securities technical chart?
What is a securities technical analysis chart?
A securities technical analysis chart is a graphical representation of how a stock's price or securities trading volume has changed over time in the past. This relationship can be presented in many different ways, through the use of different types of charts.
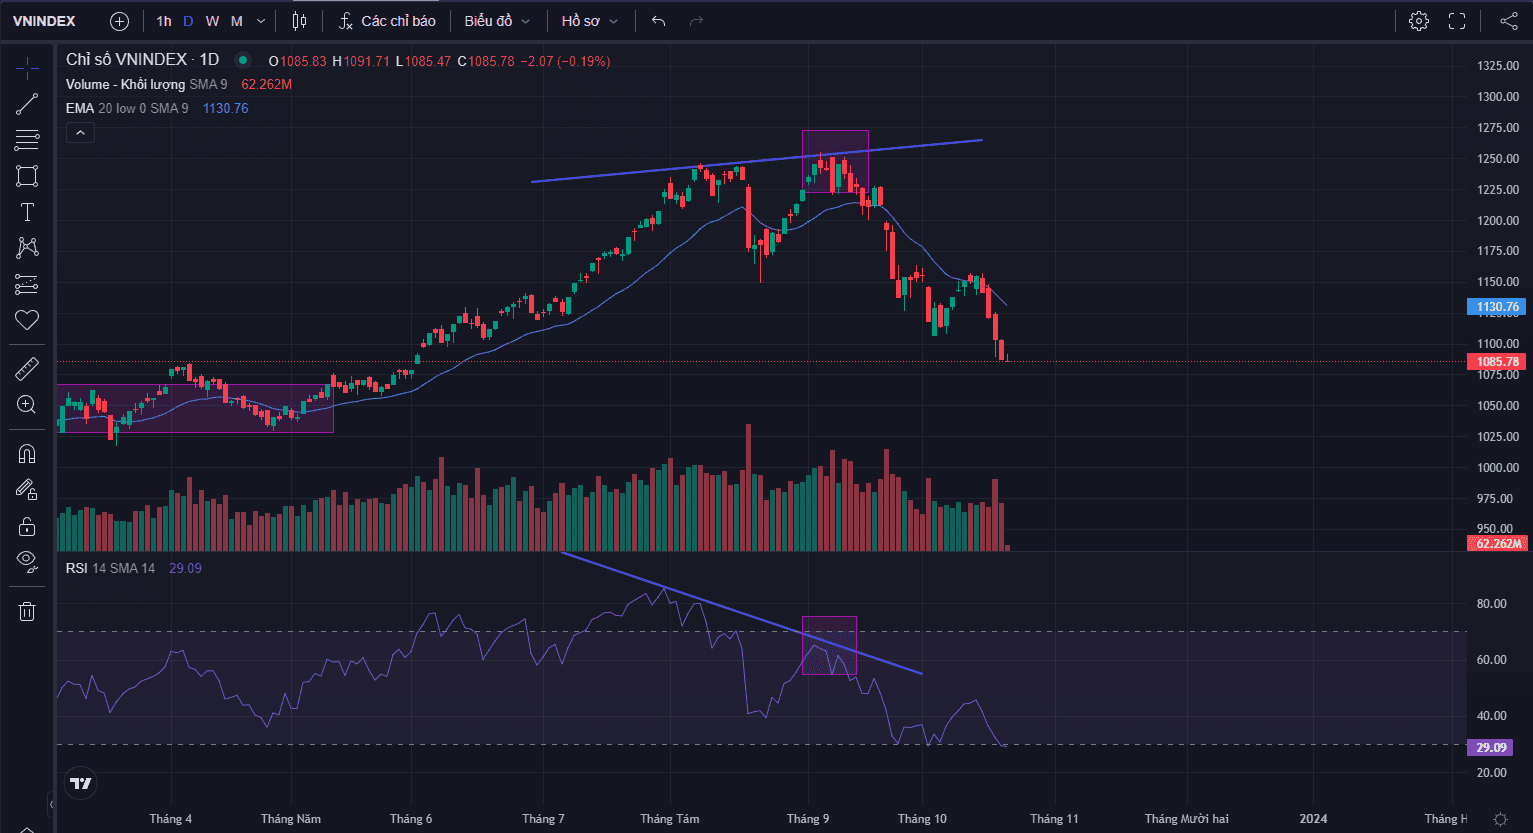
A form of securities technical analysis chart
Like all other securities technical charts, the chart has two axes - the vertical axis and the horizontal axis. The horizontal axis represents the historical time periods over which the technical chart has been constructed. The vertical axis displays the stock price or trading volume in each period.
Types of securities technical analysis charts
There are many types of charts used for technical analysis. However, there are three most common types of securities technical charts that new investors learning securities technical analysis need to know:
-
Line Charts
-
Bar Charts
-
Candlestick Charts
Some basic information on charts, a guide to securities technical analysis
Line charts
A line chart presents information about the stock price or trading volume on the vertical axis, or y-axis, and the corresponding time period on the horizontal axis, or x-axis. Trading volume refers to the number of shares of a company bought and sold on the market on a given day. The closing stock price is usually used to construct a line chart.
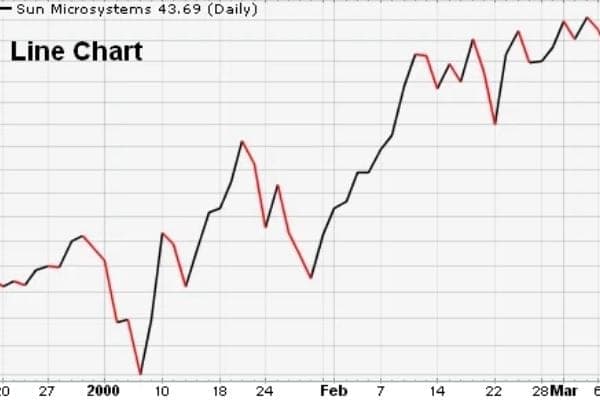
The line form of securities technical analysis chart
Bar charts
Similar to line charts, however, bar charts carry more information. Instead of a dot, each point marked on a bar chart takes the form of a vertical line with two horizontal lines protruding on either side. The top point of each vertical line represents the highest price at which the stock traded during the day, while the bottom point represents the lowest price at which the stock traded during the day. The horizontal line on the left represents the price at which the stock opened on the trading day. The symbol on the right represents the price at which it closed on the trading day.
In addition, bar charts are more advantageous than line charts because, besides price, they also reflect price volatility.
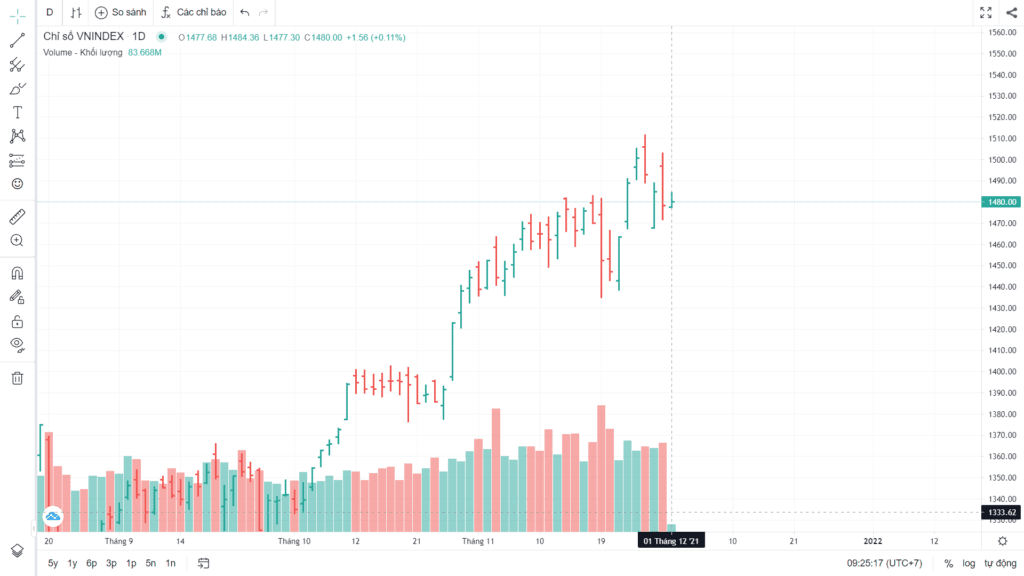
The bar form of securities technical analysis chart
Candlestick charts - the most common
Guide to securities technical analysis - a candlestick chart consists of rectangular blocks with lines extending from it on both sides. The line at the upper end represents the highest trading price of the day and the line at the lower end represents the lowest trading price of the day. Intraday trading can be displayed in the chart. During the day, for the block itself (called the body), the upper part and the lower part represent the opening and closing prices. The higher of the two is at the top, while the other is at the bottom of the body.
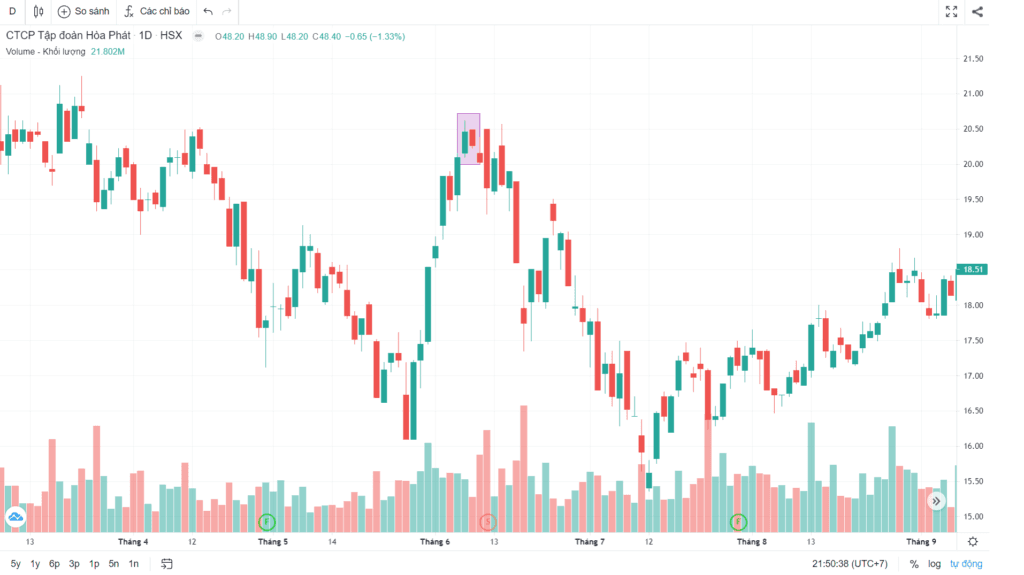
The candlestick form of securities technical analysis chart
On a candlestick securities technical analysis chart there are two shades, light and dark. On days when the opening price is greater than the closing price, their color will be lighter (usually white). Conversely, on days when the closing price is higher than the opening price, they are darker (usually black). Trading within a day is represented by the intraday chart. The greater the variation in color, the more volatile the price was during that period
Guide to reading securities technical analysis charts
Trading volume
-
High-volume trading on up days - This is an optimistic sign that the stock price will continue to rise
-
Low-volume trading on down days - This is also a bullish sign because it shows that on days when the stock price pulls back slightly, not many investors are participating in the trading.
-
High-volume trading on down days - This is considered a bearish indicator for a stock, as it shows that large institutional traders are actively selling the stock.
-
Low-volume trading on up days - This is another bearish indicator, although not as strong as high-volume trading on down days.
Indicators
There are currently many types of indicators used to analyze securities technical charts and produce the most accurate forecasts, and these indicators are usually divided into 2 basic types:
-
Trend indicators: used to determine the overall direction of a stock price, up or down, while momentum indicators assess the strength of the price movement.
-
Momentum indicators: Aimed at assessing price volatility and thereby identifying suitable entry points, such as the MACD or RSI indicators.
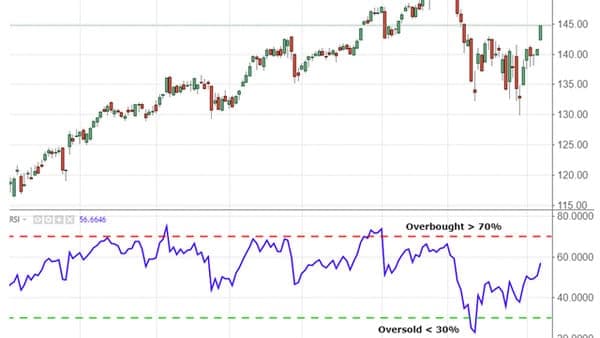
A type of momentum indicator on a stock technical analysis chart
-
RSI is an indicator used to identify an overbought or oversold market
-
RSI is usually displayed as a wave-shaped oscillating chart on a scale from 0 to 100.
Support and resistance levels
Stock charts can be especially useful in identifying support and resistance levels for a stock. Support levels are price levels at which you often see new buying emerge to support the stock price and push it back up. Conversely, resistance levels represent price levels at which the stock's attempt to rise fails, and it then tends to decline.
Some terms on stock technical charts to keep in mind
Trading timeframes
The stock trading timeframe is usually divided into 3 different phases. Each phase comprises the corresponding trading timeframes on the chart.
-
Long-term timeframes: 1Y, 1M, 1W
-
Medium-term timeframes: 1D, 4H, 1H
-
Short-term timeframes: 5m, 15m, 30m
Highest price and lowest price
What are the highest price (H) and the lowest price (L)? You can simply understand them as showing the highest and lowest price levels the stock reached within the trading timeframe, calculated from the open to the close. However, the highest price (H) and the lowest price (L) may not be the opening and closing prices.
-
Opening price: the stock price at the very moment the stock trading timeframe begins; with each 5m, 30m, 1h, 4h, 1D timeframe we have different opening prices.
-
Closing price: like the opening price, the closing price is the stock price at the moment the trading timeframe closes, in which with each 5m, 30m, 1h, 4h, 1D timeframe we will have different closing prices.
Net change
This figure is expressed as a percentage. It shows the change in value of the traded stock compared with the previous day's closing price. If the rate of change is positive, the stock is considered to have risen on the day. Conversely, if the rate of change is negative, the stock is considered to have fallen on the day.
Reading and viewing stock technical charts is a process of learning, drawing lessons and practising before one can become a stock analysis expert. Invest a portion of your time to start learning about stock chart analysis right now.
At Shinhan Securities, we provide comprehensive securities services for you, especially guidance on stock technical analysis under the advice of experts with many years of experience at Shinhan Securities Vietnam (SSV); we are committed to delivering the investment tips that any new investor needs. Leave us a message and our customer care staff will contact you as soon as possible!



