

MOVING AVERAGE (PART 2)
1. How to use three moving averages (triple crossover method)
Triple Crossover Method
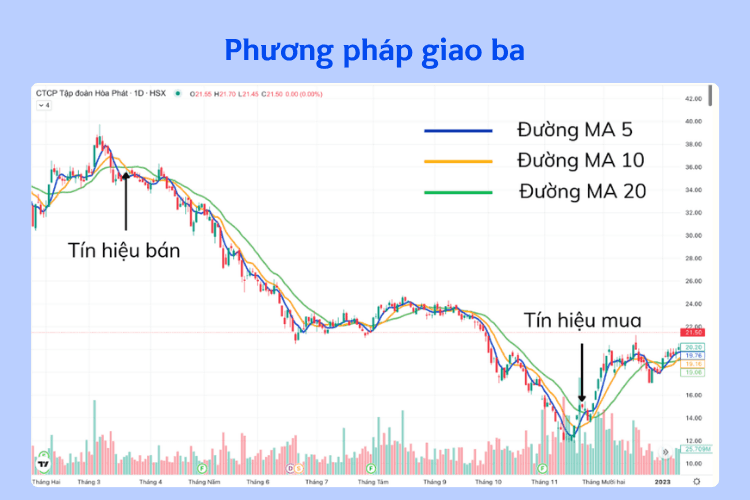
The Triple Crossover Method is a combination of the 5 - 10 - 20 day moving averages.
Buy signal
The 5-day moving average crosses above the 10-day and 20-day moving averages. The signal is confirmed if the 10-day line crosses above the 20-day line.
Sell signal
The 5-day moving average crosses below the 10-day and 20-day moving averages. The signal is confirmed if the 10-day line crosses below the 20-day line.
(In addition, in the illustration:)
- MA 5 line
- MA 10 line
- MA 20 line
- The Buy signal and Sell signal are marked on the price chart.
2. Moving averages tied to time cycles
For daily charts, we often use MA5, MA10, MA20 for short-term trends and MA50, MA100, MA200 for long-term trends. The numbers of the moving averages represent time cycles, for example:
- MA5: Represents the cycle of 5 trading days in a week.
- MA10: Represents a 2-week trading cycle.
- MA20: Represents a 1-month trading cycle.
- MA50: Represents a 1-quarter trading cycle.
- MA100: Represents a 6-month trading cycle.
- MA200: Represents a 1-year trading cycle.
3. Advantages and disadvantages of moving averages
3.1. Advantages of moving averages
- Moving averages help us identify market trends.
- Moving averages provide clear rules and buy/sell signals
3.2. Disadvantages of moving averages
- They are only effective when the market is trending.
- They do not work well when the market swings sharply up and down or moves sideways.
Note
Moving averages do not work well when the market swings sharply up and down or moves sideways.
At important moments and during strong volatility, we need to apply other technical indicators such as Stochastic, RSI, MACD, etc.
The bands surrounding the moving average - Envelope
- The usefulness of a moving average is increased when the bands surrounding it are plotted.
- These lines are placed at fixed percentages above and below the moving average, forming two bands around the moving average.
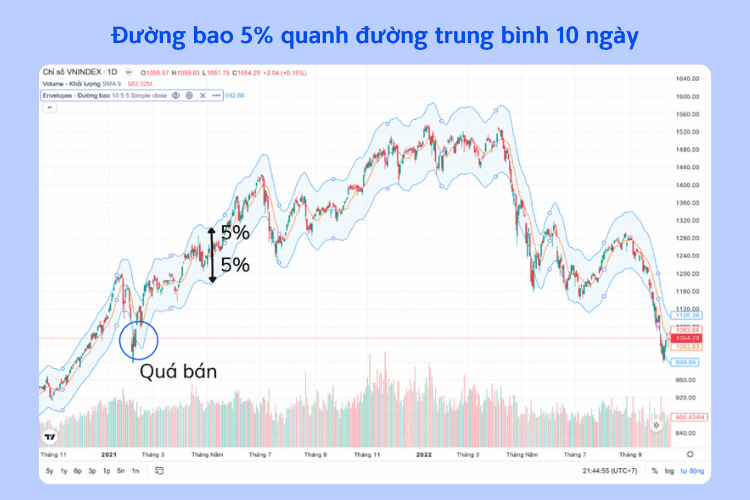
- These two bands indicate when the price has moved too far away from the moving average. Price moving outside these envelopes shows that the market is overbought or oversold.
For example: Short-term traders often use a 3% envelope around the 21-day simple moving average.
Figure: 5% envelope around the 10-day moving average
Bollinger Band
- Similar to the envelope technique. However, the two bands of the Bollinger Band are based on two standard deviations of the 20-day moving average.
- The upper band and the lower band are regarded as resistance and support levels. A sell signal appears when the price touches the upper band and a buy signal appears when the price touches the lower band.
- The standard deviation shows how the price will fluctuate around the moving average. Normally, the price is considered overbought when it touches the upper band or oversold when it touches the lower band.
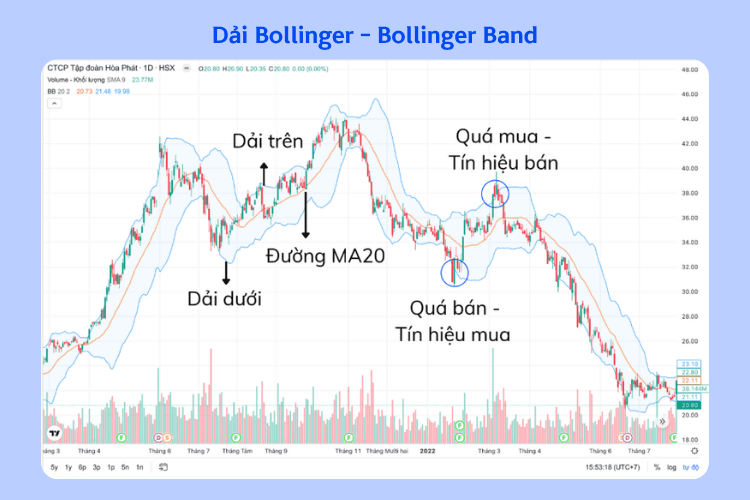
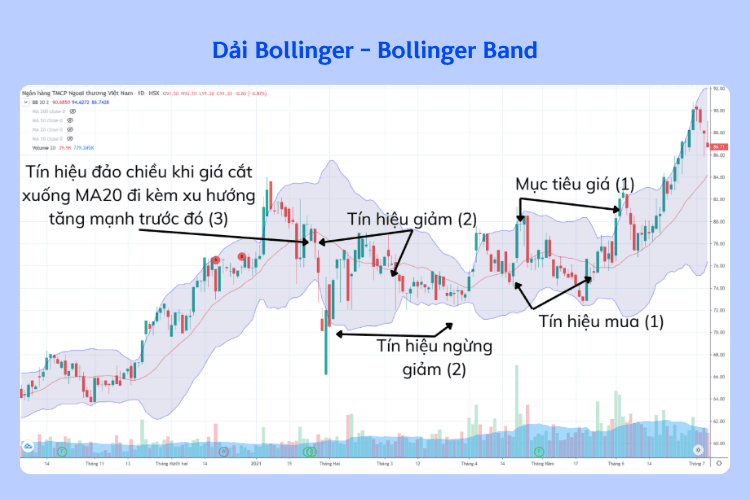
- If the price rises from the lower band and exceeds the 20-day moving average, the upper band will become the price target. Investors can buy when the price crosses above the MA20 and take profit when the price touches the upper band (1).
- Conversely, when the price falls below the 20-day moving average, the lower band will become the target price at which the decline stops (2).
- In a strong uptrend, the price often fluctuates between the upper band and the 20-day moving average. Crossing from above to below the 20-day line will be a warning of a reversal (3).
The Bollinger Bands tend to widen or narrow based on the price volatility of the most recent 20 days. Therefore, when the price fluctuates little or when the market moves sideways, the bands will narrow. When the market is highly volatile, the bands will widen.
When the bands suddenly change width, this may be a sign that the current trend is ending (1), or when the distance between the two bands narrows too quickly, that is a sign that the market is about to begin a new trend (2).
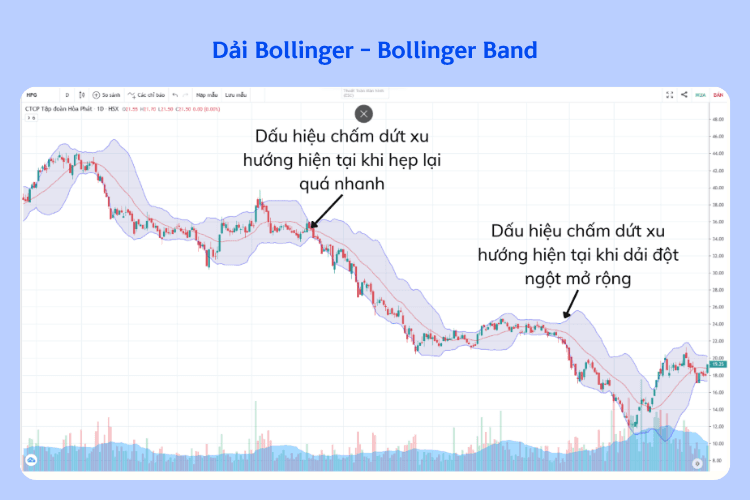
Bollinger Bands can be used on weekly or monthly charts by using the 20-week or 20-month moving average.
This indicator will give the best forecasts when combined with other technical indicators such as RSI, MACD, etc.
We hope that the investment knowledge from Shinhan has helped investors better understand the business results report
(!) This article is for informational purposes only and is not investment advice. Readers should conduct their own research or consult an expert before making financial decisions.



