

MOVING AVERAGE (PART 1)
1. What is a moving average (MA)?
A moving average is an average line that shows the mean level of a stock's price over a given period of time.
The MA line is used as 1 tool that relies on past price data to signal trends. Therefore, the MA line will lag behind market movements. Although it is a lagging indicator, this tool helps investors observe trends more easily by smoothing price fluctuations into a clearer trend line.
Simple moving average SMA
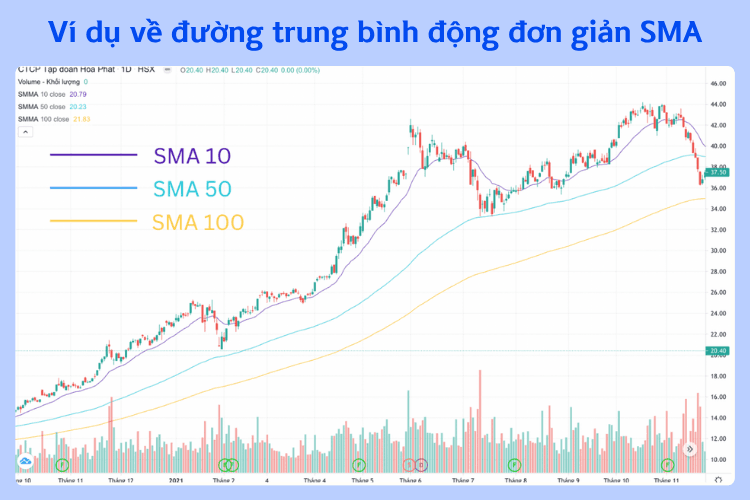
The SMA line is determined by the arithmetic average of price data over a period of time. The SMA treats the price of each day as having equal weighting.
Example:
The SMA 10 line: Take the closing prices of the 10 most recent days, add them together and divide by 10. Usually a “segment” is used because the prices of the 10 most recent days are calculated. When each new trading day ends, the price calculation data moves forward and creates 1 new average point. These points are connected together to form the SMA 10 line.
a. Commonly used SMA lines
- MA lines used for the long term: SMA (100), SMA (200).
- MA line used for the medium term: SMA (50).
- MA lines used for the short term: SMA (10), SMA (14), SMA (20).
“Short-term moving averages are more sensitive to price movements, while long-term moving averages are less sensitive.”
b. Advantages and disadvantages of the SMA
Advantages
The SMA line smooths out price fluctuations, thereby eliminating short-term price noise. It helps investors focus more on the main trend.
The SMA line is widely used, so it reflects investor sentiment well at support or resistance levels.
Disadvantages
It treats each day's price with the same weighting. As a result, the SMA reacts slowly and lacks sensitivity to short-term price movements.
2.2. Weighted Moving Average WMA
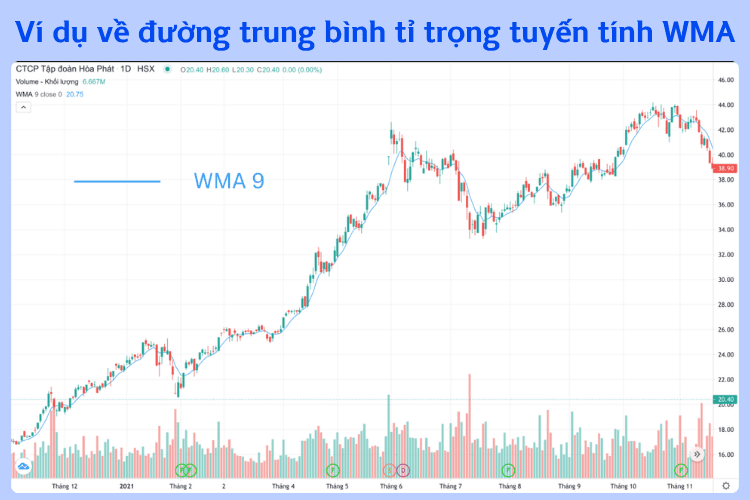
Some technical analysts apply the linearly weighted moving average in order to overcome the weighting limitation of the simple moving average SMA.
With the WMA, more recent closing prices are given a greater weighting.
2.3. Exponential Moving Average EMA
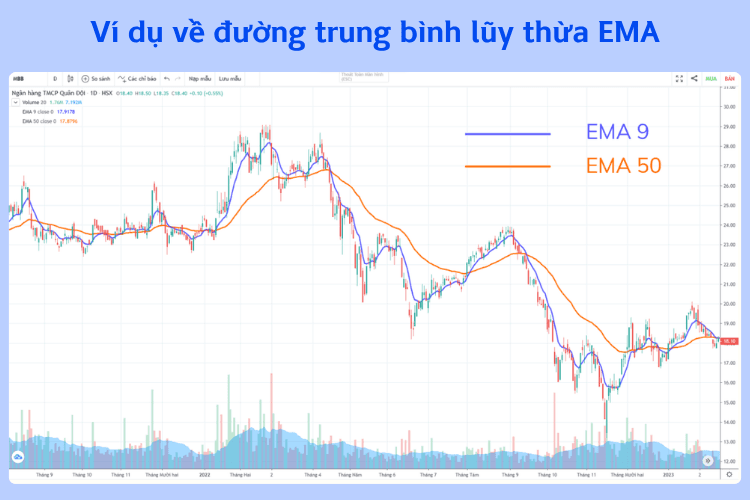
The exponential moving average EMA is an indicator that reflects price movements exponentially. Therefore, EMA is considered quite sensitive to short-term fluctuations, helping investors detect unusual signals more easily than with SMA.
- Slow EMA – long-term EMA is usually EMA50, EMA100, EMA200.
- Fast EMA – short-term EMA is usually EMA9, EMA25.
a. Advantages and disadvantages of EMA
Advantages: The EMA assigns a greater weighting to more recent data, therefore the EMA is sensitive to the market in the short term → High level of accuracy.
Disadvantages: Because it is overly sensitive to fluctuations, the EMA generates some noise signals that may cause investors to fall into price traps.
When choosing long EMAs such as 100, 200, etc., investors easily miss short-term opportunities in the market, but long-term reliability remains high.
3. How to use a single moving average
Application principles
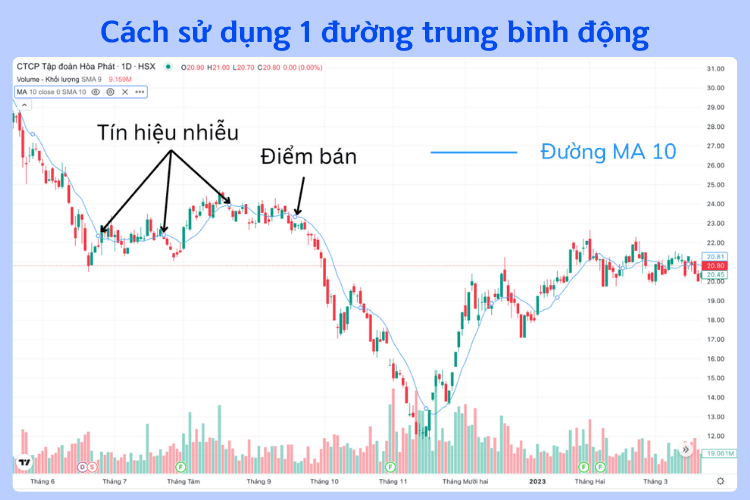
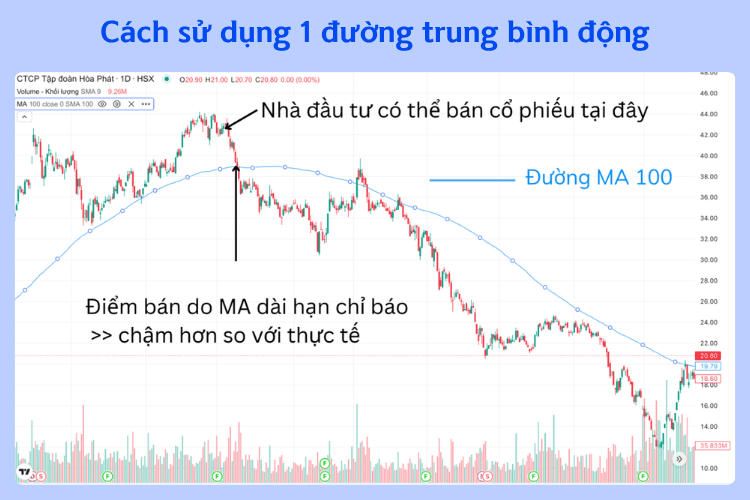
- Buy when the closing price moves above the MA line.
- Sell when the closing price moves below the MA line.
The short-term MA line hugs the price line more closely but gives more noise signals as it is quite sensitive to random short-term fluctuations.
Meanwhile, the long-term MA line overcomes the noise signals of the short-term MA line. However, it does not track closely and does not give timely signals.
Therefore, it can be said that the short-term moving average is effective in identifying trend reversals, while the long-term moving average is effective when a trend is still being maintained.
4. How to use two moving averages to generate signals
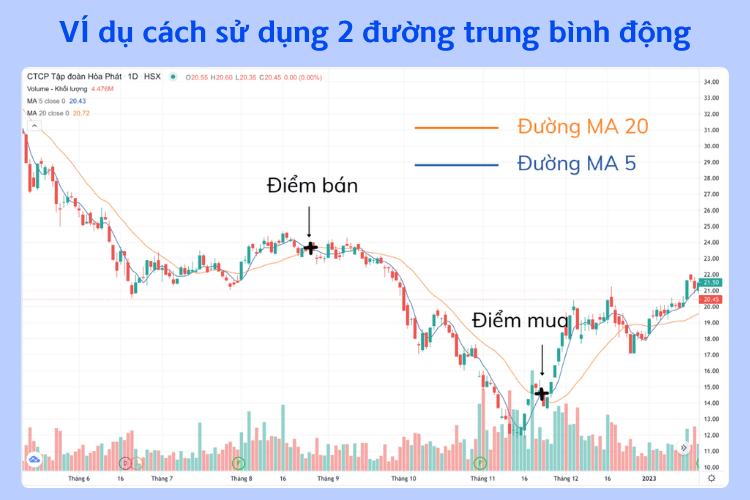
This technique is called the Double Crosscover Method. A buy signal is generated when the short-term moving average crosses above a long-term moving average.
A sell signal is generated when the short-term moving average crosses below the long-term moving average.
5. Some common applications of two moving averages crossing each other
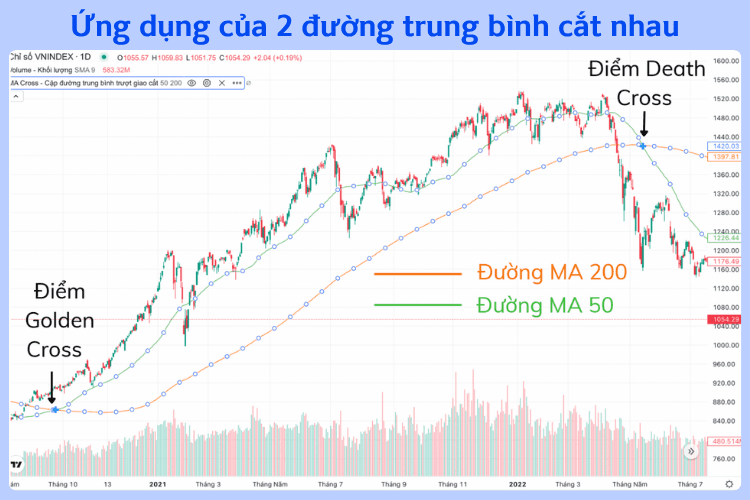
The Golden Cross is formed when the MA50 moving average crosses above the MA200 moving average. Combined with a sharp increase in trading volume, this is a confirmation signal for a price rally.
A Death Cross is the downward crossover of the MA50 moving average and the MA200 moving average. If trading volume suddenly surges (a sign that investors are selling off), this serves as a stronger confirmation of the downtrend.
We hope that this investment knowledge from Shinhan has helped investors gain a better understanding of business performance reports
(!) This article is for informational purposes only and does not constitute investment advice. Readers should conduct their own research or consult a professional before making any financial decisions.



