
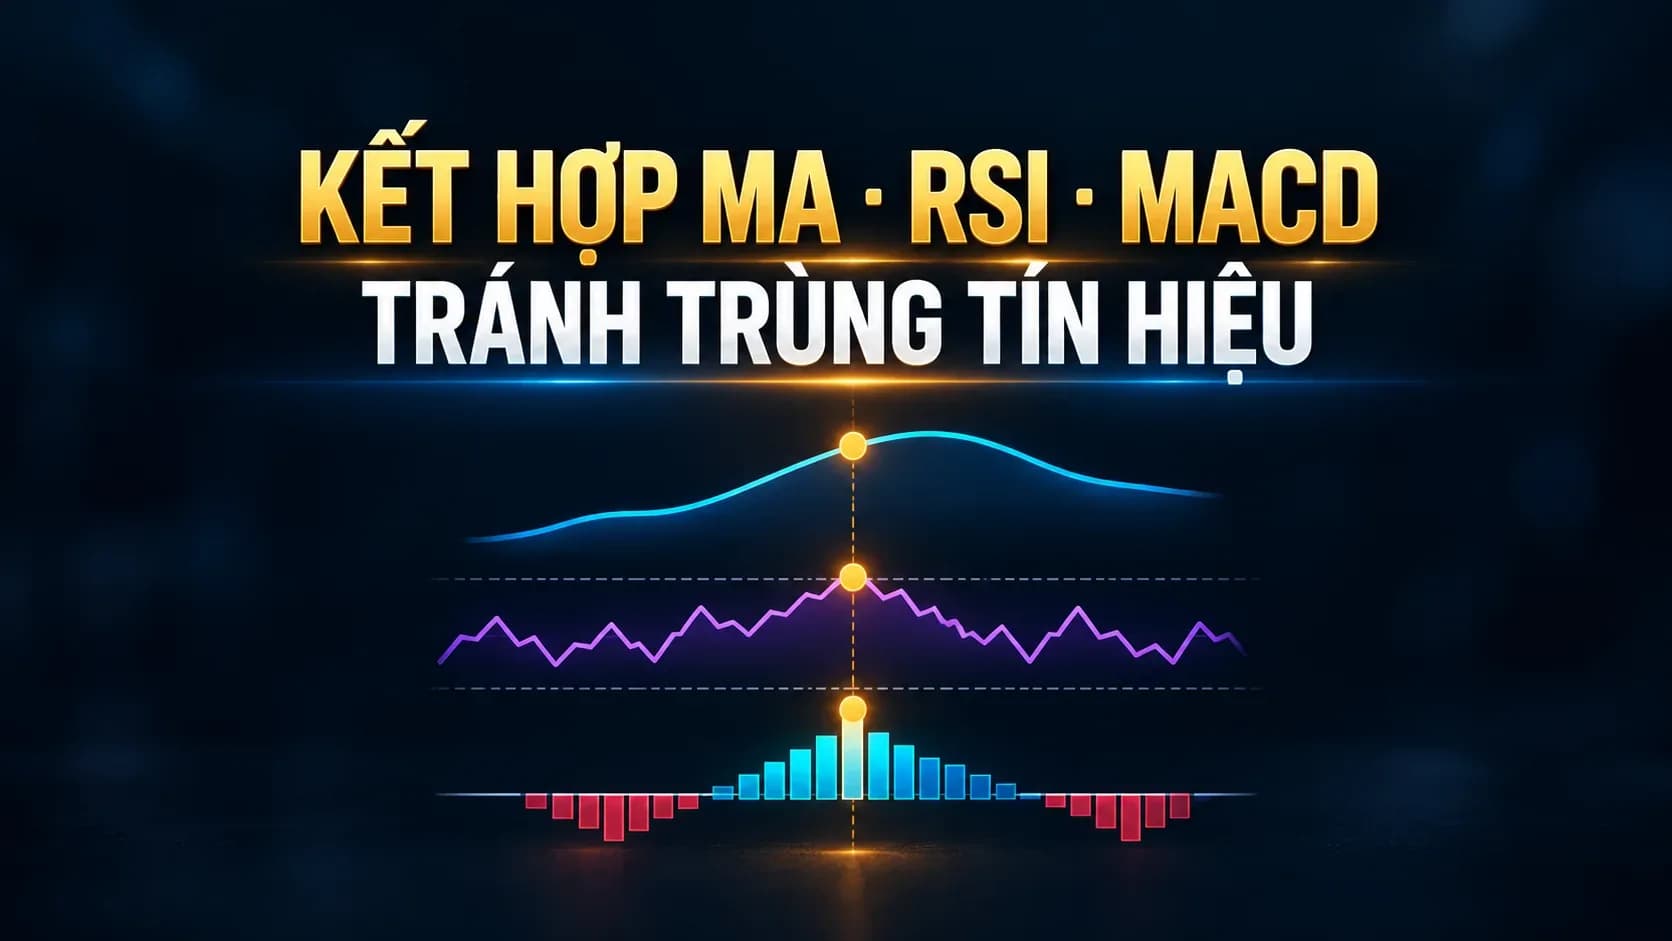
Quick answer: You can combine MA, RSI and MACD if each tool has a clearly defined role: MA to establish the trend context, RSI to assess momentum conditions, and MACD to track shifts in trend – momentum. Since all three are calculated from price, three signals pointing the same way should not be treated as three fully independent sources of confirmation.
Quick summary
- MA identifies the direction and structure of the trend.
- RSI assesses relative strength, momentum zones and divergences.
- MACD observes crossovers, the 0 line and the rate of change in momentum.
- All three indicators are based on price, so they may duplicate information.
- Price, volume and risk management must come before indicator signals.
Why do more indicators not mean more confirmation?
MA stands for Moving Average. RSI is the Relative Strength Index, while MACD is the Moving Average Convergence Divergence indicator. Although their formulas differ, all three use past price data. If price rises continuously, the MA may slope upward, RSI may rise and MACD may cross up almost simultaneously. These may simply be three ways of expressing the same move.
Counting these three signals as three independent pieces of evidence leads investors to overestimate their level of certainty. A better approach is to assign roles, then add another source of information such as volume, price structure or market context.
Assigning a role to each indicator
| Tool | Main role | Question to answer |
|---|---|---|
| MA | Trend context | Is price above or below the moving average? Is the line sloping? Does the peak – trough structure agree? |
| RSI | Momentum condition | Is momentum strengthening or weakening? Is there a divergence? Is RSI moving within the range of an uptrend or a downtrend? |
| MACD | Shift in trend – momentum | Are the MACD and the signal line converging or diverging? Is the histogram expanding or narrowing? Where is it relative to the 0 line? |
| Price and volume | Real-world confirmation | Has price broken the structure? Has participation broadened? Where is the invalidation point? |
A process for combining them, from context to action
- Read price first: identify the trend, support, resistance and accumulation zones.
- Use the MA as a filter: for example, only look for trend-following scenarios when price sits above an upward-sloping MA. This is an example of a process, not a mandatory rule.
- Use RSI to assess the pullback: see whether momentum is cooling without breaking the structure.
- Use MACD to observe improvement: watch for a narrowing histogram, crossovers or the position relative to the 0 line.
- Wait for price and volume to confirm: indicator signals need to be translated into conditions observable on price.
- Plan your risk: define the entry point, the invalidation level, the reward/risk ratio and the position size.
Example of a trend-following scenario
Stock F has a rising peak – trough structure, with price above an upward-sloping MA 50. During a pullback, price retreats to the support zone and the MA 50, RSI falls from a high zone back to around neutral but does not form an extremely low trough. The MACD histogram is negative but narrowing. When price clears the short-term peak with improving volume, the tools are performing their proper roles: the MA describes the context, RSI shows the cooling phase, MACD shows momentum recovering and price – volume confirms.
If price breaks support and closes clearly below the invalidation zone, the scenario no longer applies even if RSI or MACD have not yet reacted. Price is always the final execution data.
Example of a scenario to avoid
In a sideways market, price repeatedly crosses a flat MA. RSI oscillates around 50 and MACD crosses many times near the 0 line. Buying whenever all three have just turned positive and selling whenever all three turn negative can lead to overtrading. In this context, priority should go to the support – resistance band, waiting for a breakout or standing aside if the reward/risk ratio is not attractive.
How to reduce signal duplication?
- Choose only one tool for each question: trend, momentum, confirmation and risk.
- Do not mechanically add up points for indicators that all use price.
- Add volume or fundamental data if the holding period is longer.
- Write down entry, exit and invalidation conditions before looking at the outcome.
- Test the strategy across many market conditions, not just favourable periods.
A simple reference framework
| Step | Observable condition | If not met |
|---|---|---|
| Context | Price and MA show a clear trend | Switch to a sideways strategy or wait |
| Momentum | RSI is consistent with the pullback or the recovery | Do not predict a reversal merely because of overbought/oversold readings |
| Shift | MACD/histogram improves in line with the scenario | Wait further, do not force the signal |
| Confirmation | Price breaks the structure, volume is consistent | Do not participate or lower your confidence level |
| Risk | There is an invalidation point and a position size | Do not execute the trade |
Common mistakes
- Using too many MA lines at once, making the chart hard to read.
- Waiting for all three indicators to agree completely, so the signal becomes far too late.
- Changing parameters until the past looks perfect.
- Failing to distinguish between trending and sideways markets.
- Only optimising the entry point without exit rules and loss limits.
A three-step framework to avoid using overlapping indicators
Step 1 – Context: use price and the MA to classify the trend as up, down or sideways. Step 2 – Setup: use RSI to assess the pullback or the momentum condition at key price zones. Step 3 – Trigger: use price structure, volume and, where needed, improvement in MACD to pick the timing. Each tool answers only one question, which makes the process easier to review.
If MA, RSI and MACD all merely repeat that price has just risen, the number of signals does not triple the probability. More valuable confirmation usually comes from another source: support – resistance levels, volume, liquidity, the broader market or fundamental factors suited to the holding period.
Example of a conditional trading plan
| Component | Illustrative example |
|---|---|
| Context | Price above an upward-sloping MA 50 and the structure is still higher highs – higher lows |
| Setup | Price pulls back to support; RSI cools down to the neutral zone |
| Trigger | Price breaks the short-term high; MACD/histogram improves; volume rises |
| Invalidation | Price closes below support or breaks the low of the setup |
| Management | Position size is calculated from the maximum acceptable loss |
This is only an educational example, not a formula applicable to every ticker. What matters is that the conditions are written in advance, are observable and are not changed on emotion after entering the position.
Checklist before execution
- Have the three indicators been assigned distinct roles, or are they all measuring the same movement?
- Does the scenario suit a trending or a sideways state?
- Which specific price behaviour is the entry point based on?
- Is the invalidation level reasonable and does the position size cap the risk?
- Are results recorded so they can be assessed over a sufficient number of trades?
Frequently asked questions
Is it necessary to use all of MA, RSI and MACD?
No. If two tools already answer all the questions in the process, adding an indicator may only add complexity. The goal is consistent decisions, not a number of signals.
Which parameters are best?
There are no best parameters for every ticker and time frame. Choose parameters that suit your objective, test them and stay consistent.
Does combining three indicators eliminate false signals?
No. Every indicator has false signals and lag. Risk management is a mandatory part of the process.
Disclaimer
This content is provided for educational and reference purposes and is not a recommendation to buy, sell or hold any security. Technical analysis is based on past data and does not guarantee future results. Investors should assess their own objectives, experience and risk tolerance before making a decision.



