

COMMON INDICATORS IN TECHNICAL ANALYSIS (PART 1)
General introduction
Technical indicators are formulas that calculate or forecast price based on the price pattern, volume or supply and demand of a stock.
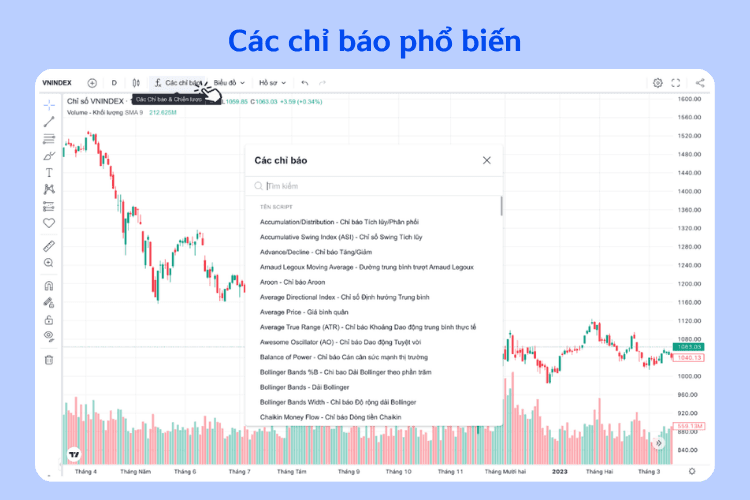
Investors can apply these indicators through popular supporting
platforms in the indicators section:
-
Momentum indicator
It measures the speed of a price increase or decrease by measuring the change of the most recent price against the closing price of "x" days earlier.
For example: A 10-day momentum line measures the difference between the latest price and the price 10 days earlier.
- If the closing price > the price of "x" days earlier, the momentum line will lie above the 0 line.
- If the closing price < the price of "x" days earlier, the momentum line lies below the 0 line.
- A short momentum line will be more sensitive, with greater fluctuations.
- A long momentum line will be flatter, with lower fluctuations.
Figure 1-a: Analysis of the 10-day momentum line
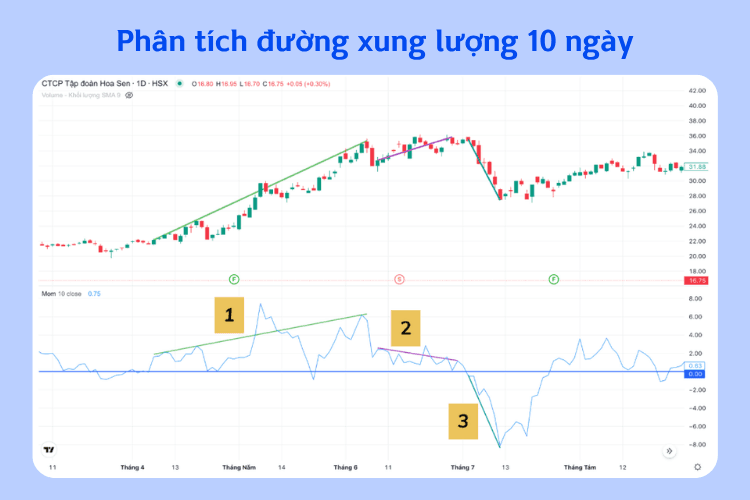
When the price rises and the momentum line lies above the 0 line, it shows that an uptrend is building up. If the upward move continues and the momentum line moves further away from the 0 line, the uptrend is accelerating (note 1).
When the price rises but the momentum line gradually flattens, it shows that the pace of the increase is weakening.
When the momentum line falls close to the 0 line but the price trend is still rising, it means the pace of the price increase is slowing down (note 2).
A momentum line below the 0 line shows that a downtrend is approaching. If the downward move continues and momentum moves further away from the 0 line, the downtrend is accelerating (note 3).
Figure 1-b: Using the 10-day momentum line as a buy/sell signal
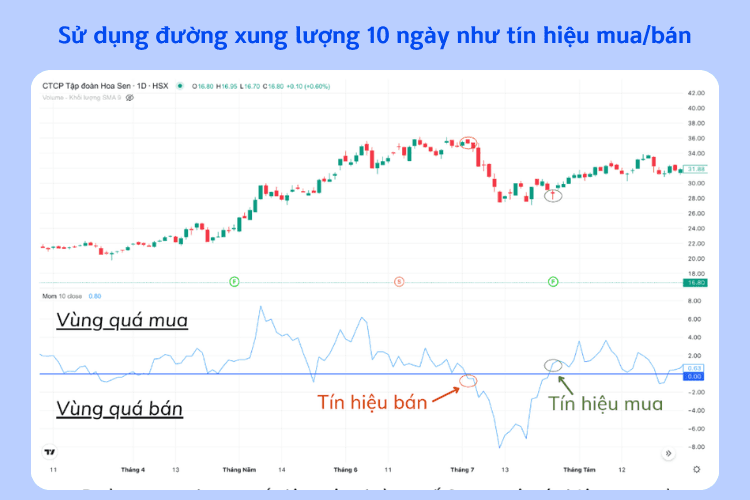
- The momentum line crossing above the 0 line creates a buy signal.
- The momentum line crossing below the 0 line creates a sell signal.
-
Rate of change indicator (rate of change - ROC)
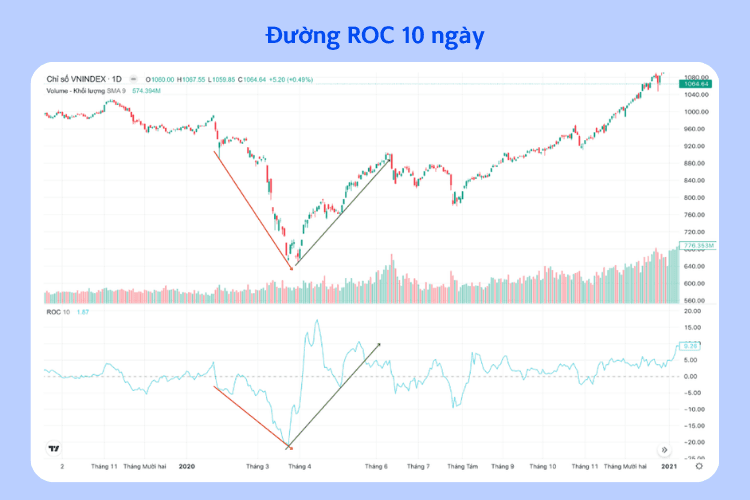
ROC is used to measure the speed of change by calculating the ratio of the most recent closing price to the closing price of "x" days earlier. The ROC line is applied in the same way as the momentum line.
Figure 2: The 10-day ROC line
- If the ROC line lies above 0, it usually confirms an uptrend, and if the ROC line lies below 0, it indicates a downtrend.
- When the price is consolidating, the ROC line will fluctuate close to 0. In this case, investors must monitor the price trend because the ROC line provides very little information.
-
Commodity channel index ((commondity chanel index– CCI)
It measures the current price level against the moving average price of a predetermined period, usually 20 days. The CCI fluctuates in a range from -100 to 100.
Figure 3: The 20-day CCI line
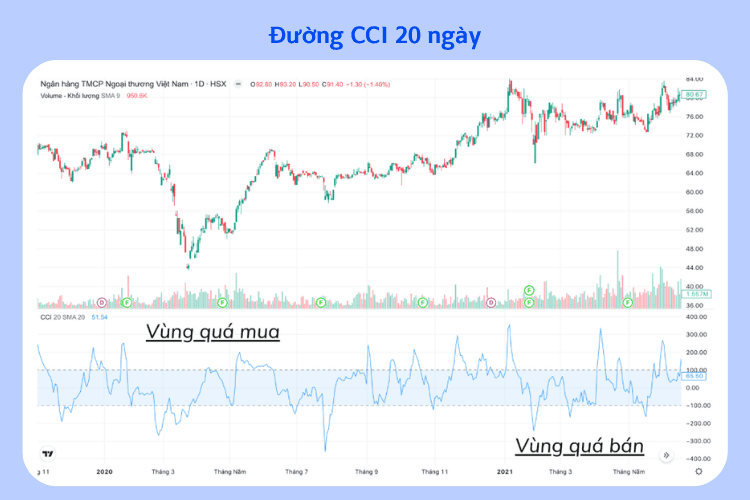
- Overbought zone
- Oversold zone
- This index is used by analysts to identify overbought or oversold zones. If the index is above +100, it is considered overbought, and below -100, it is considered oversold.
- The default period of CCI is 20 days. However, analysts can change the number of days to adjust the sensitivity of the index.
-
Relative strength index (relatives strength index - RSI)
- It is used to measure the speed and magnitude of recent closing price changes in order to assess whether the price is in a too high or too low zone.
- The RSI helps detect overbought and oversold conditions, trend reversals or signals a price correction of a stock.
Figure 4: The 14-day RSI line
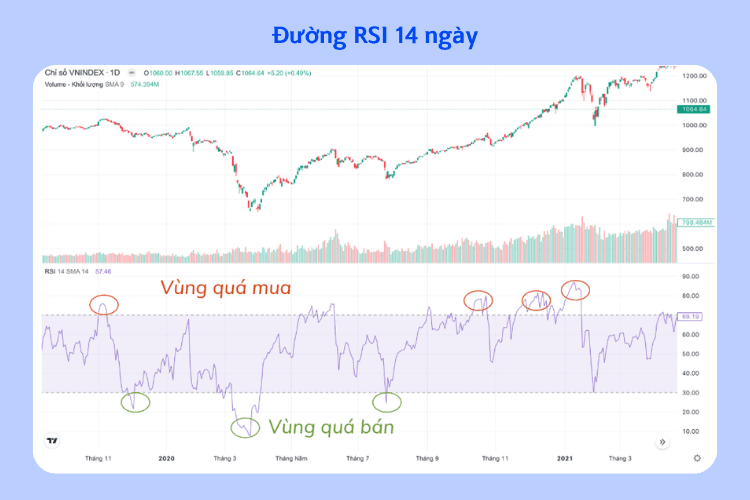
- Overbought zone
- Oversold zone
RSI is designed only as a line chart with a value range from 0 to 100. An RSI above the 70 level indicates an overbought condition and below the 30 level indicates an oversold condition.
RSI periods
- The 9-period and 14-period are the time frames commonly used for the calculation.
- Analysts can use a 5–7 day period to increase the fluctuation of the RSI for very short-term trading.
- Or use a 21–28 day period to smooth the RSI line in order to remove noise in short-term trading.
Important notes
- The shorter the period used, the more sensitive the index fluctuates and the wider the fluctuation range.
- The RSI line works best when it is at the extreme levels above or below.
Figure 5: The 14-day RSI line and the 7-day RSI line
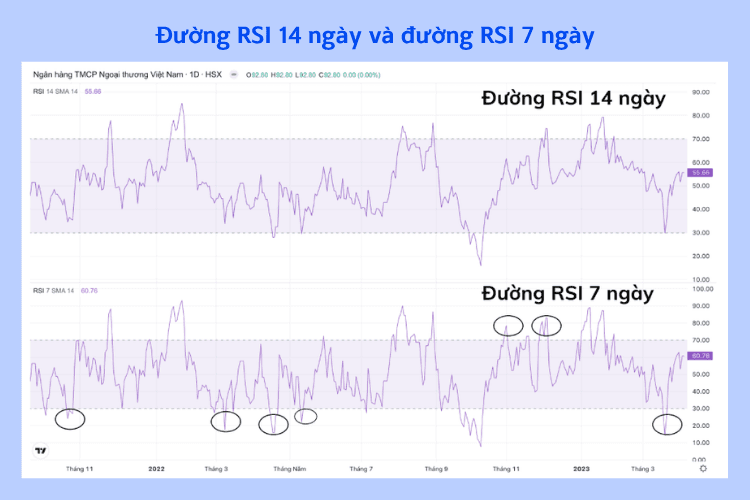
- The 14-day RSI line
- The 7-day RSI line
The fluctuation range of the RSI line can be widened by shortening the calculation period of the RSI line.
Figure 3 shows that the 7-day RSI line reaches the extreme levels more often than the 14-day RSI line. This makes the RSI line more “favoured” in very short-term trading.
-
Divergence
- Divergence occurs when the price trend of a stock moves in the opposite direction to that
of a technical indicator line. Divergence warns that the current price trend may be weakening and, in some cases, may lead to a reversal of the price trend.
- There are 2 common types of divergence: regular divergence and hidden divergence.
- Regular divergence is used to identify trend reversals.
- Hidden divergence gives a signal of the continuation of the previous trend.
Figure 6: Regular divergence between the price trend and the 14-day RSI line
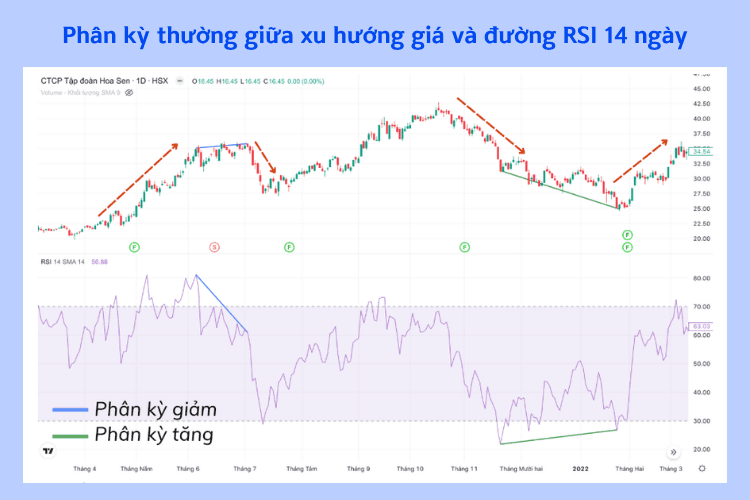
- Bearish divergence
- Bullish divergence
In a regular bearish divergence, within an uptrend, the price forms higher highs while the RSI indicator forms lower highs. This signals a reversal of the trend. The result is the start of a downtrend.
In a regular bullish divergence, within a downtrend, the price forms lower lows while the RSI indicator forms higher lows. This signals a reversal of the trend. The result is the start of an uptrend.
Figure 7: Hidden bullish divergence between the price trend and the 14-day RSI line
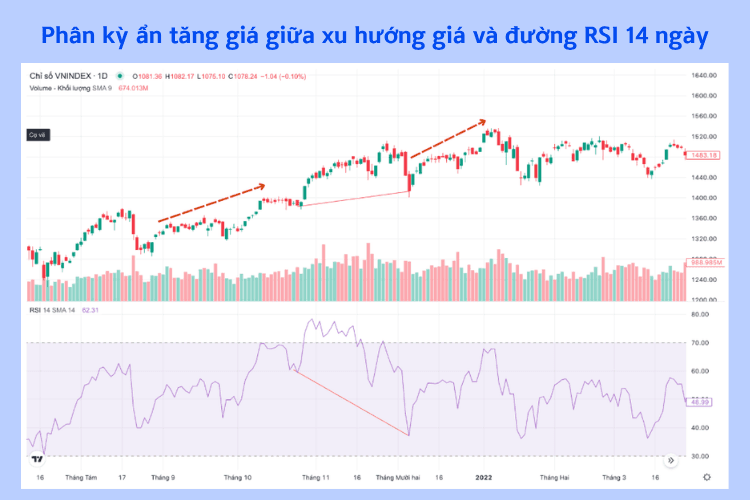
In an uptrend, the price forms higher lows but the RSI line forms lower lows. This signals that the uptrend will continue.
Figure 8: Hidden bearish divergence between the price trend and the 14-day RSI line
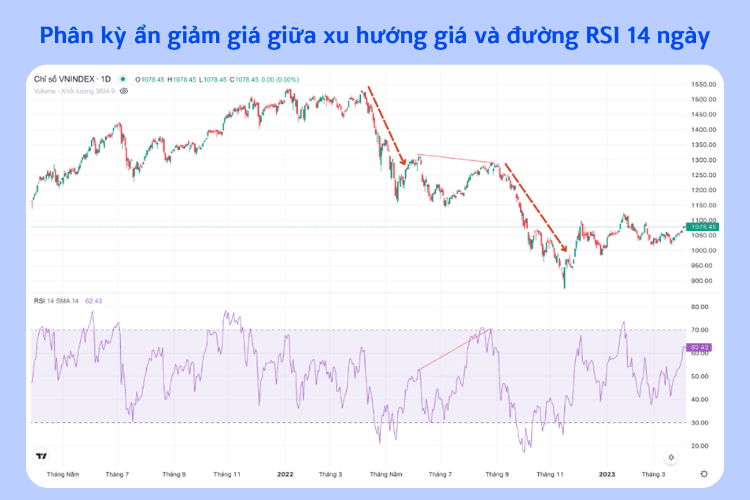
In a downtrend, the price forms lower highs but the RSI line forms higher highs. This signals that the downtrend will continue.
How to distinguish divergence signals
| DISTINGUISHING DIVERGENCE SIGNALS | |
| Regular divergence | Hidden divergence |
|
|
We hope that this investment knowledge from Shinhan has helped investors gain a better understanding of the business results report
(!) This article is for informational purposes only and is not investment advice. Readers should conduct their own research or consult an expert before making financial decisions.



