
Stock market indicators are useful tools that help investors assess market trends, forecast share price movements and make effective investment decisions. There are many different types of stock market indicators, each carrying its own meaning and function. In the article below, join Shinhan Securities Vietnam (SSV) to explore the details!
1. Benefits of analysing stock market indicators
Analysing stock market indicators means studying investor behaviour and the impact of that behaviour on price movements and trading volume. This is done in order to identify the stages of market development.
Historical data on share prices and trading volume helps investors identify market trends. It also enables them to forecast price movements and generate BUY and SELL signals in order to make sound investment decisions with the potential to deliver strong results. Combining fundamental analysis with technical indicators in securities helps investors build an optimal trading strategy and achieve the best possible returns.

Analysing stock market indicators brings great benefits to investors
2. Technical analysis stock market indicators
There are many ways to identify stock market trends, and using technical indicators is a popular method. Below are some stock market indicators that investors should pay attention to.
2.1. Moving Average (MA)
The Moving Average (MA) is a simple technical analysis tool used to track market trends. The MA is calculated by taking the average price over a specific number of trading sessions.
There are many different types of moving averages, of which the most common are the Simple Moving Average (SMA) and the Exponential Moving Average (EMA).
How to use the moving average to identify market trends:
- Uptrend: When the moving average is pointing upwards, the trend is considered an uptrend.
- Downtrend: When the moving average is pointing downwards, the trend is considered a downtrend.
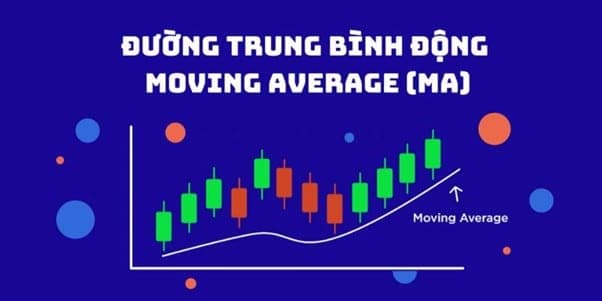
Moving Average (MA)
2.2. Moving Average Convergence Divergence (MACD)
MACD (Moving Average Convergence Divergence) is a technical indicator that is more complex than the MA, used to identify market trends and reversal signals. MACD is calculated by taking the difference between the 12-day Exponential Moving Average (EMA) and the 26-day EMA.
How to use MACD to identify market trends:
- Uptrend: When the MACD line crosses above the signal line and the Zero line from below, the trend is considered an uptrend.
- Downtrend: When the MACD line crosses below the signal line and the Zero line from above, the trend is considered a downtrend.
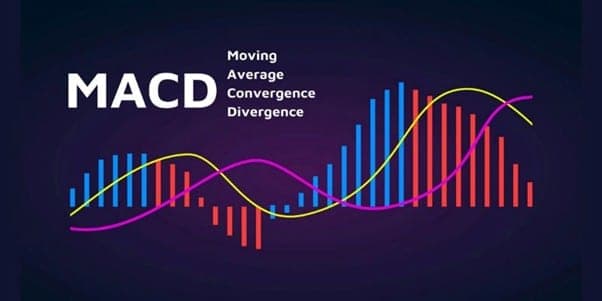
Moving Average Convergence Divergence (MACD)
2.3. Bollinger Bands
Bollinger Bands are a useful technical indicator used to identify trends and support and resistance levels in the market. Bollinger Bands consist of three main lines:
- The moving average: This is a moving average of price over a fixed period of time.
- The upper band: This line is calculated by adding two standard deviations of price to the moving average.
- The lower band: This line is calculated by subtracting two standard deviations of price from the moving average.
How to use Bollinger Bands to identify market trends:
- Uptrend: When price sits within the upper Bollinger Band area, the trend is considered an uptrend.
- Downtrend: When price sits within the lower Bollinger Band area, the trend is considered a downtrend.
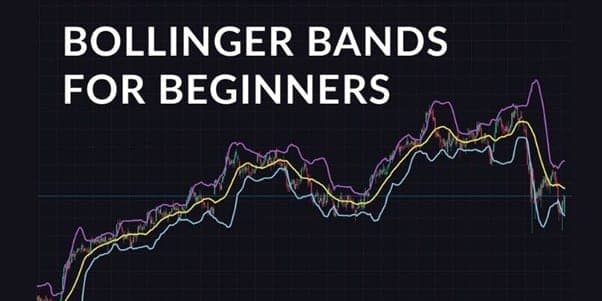
The Bollinger Bands indicator
2.4. Trendlines
A trendline is a straight line drawn to connect price peaks or troughs. This line is used to identify trends and support and resistance levels on the price chart.
How to use trendlines to identify market trends:
- Uptrend: When price continues to move above the trendline, the trend is considered an uptrend.
- Downtrend: When price continues to move below the trendline, the trend is considered a downtrend.
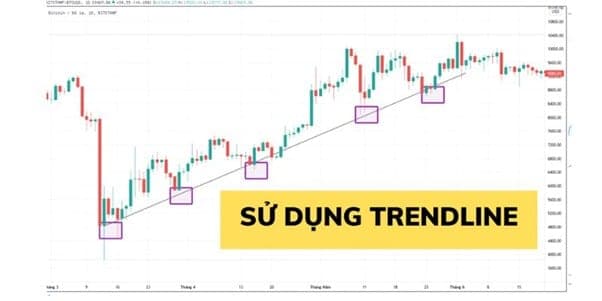
The trendline indicator
2.5. Parallel price channels
A parallel price channel is a price range bounded by two parallel straight lines. This channel can be used to identify trends and support and resistance levels on the price chart.
How to use parallel price channels to identify market trends:
- Uptrend: When price moves within the parallel price channel and the upper line of the channel trends gradually upwards, the trend is considered an uptrend.
- Downtrend: When price moves within the parallel price channel and the lower line of the channel trends gradually downwards, the trend is considered a downtrend.
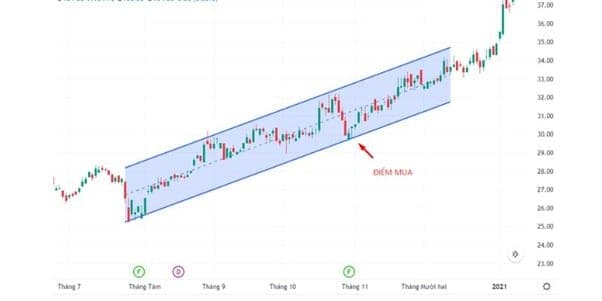
Parallel price channel indicator
3. Vietnam's leading securities trading platform
Shinhan Securities Vietnam (SSV) is a reputable securities company from Korea's leading financial group. With strong financial capacity and extensive experience in the securities sector, Shinhan Securities Vietnam (SSV) is proud to be a reputable trading platform, providing customers with comprehensive, high-quality investment services.
In order to help customers optimise their investment costs, SSV applies a lifetime zero-fee trading policy for customers and the most competitive margin lending interest rates on the market. In addition, the San Xin Ha securities trading application is safe, secure and smooth, and together with the support of advisory experts, it gives you a great experience when investing.

Vietnam's leading reputable securities trading platform
Through the article we have shared, it can be seen that by using securities indicators intelligently and combining them with your own knowledge and experience. Therefore, investors can enhance their chances of success in the stock market right today!



