

Stock indicators are indispensable tools for investors participating in the financial markets. By combining these indicators effectively, investors can build an optimal trading strategy that delivers profits. Let's explore the technical indicator tools that work effectively and are favoured within the investment community in the content below.
Support and resistance
Support and resistance are two important concepts among technical stock indicators. These indicators are understood as price zones at which a stock's price trend may reverse or slow down.
Support is the price zone where a stock is trending downwards and is expected to reverse upwards. At this price zone, buying pressure on the stock will prevail over selling pressure, causing the stock price to trend upwards.
Conversely, resistance is the price zone where a stock is trending upwards and is expected to reverse downwards. At this price zone, selling pressure on the stock will prevail over buying pressure, causing the stock price to trend downwards.
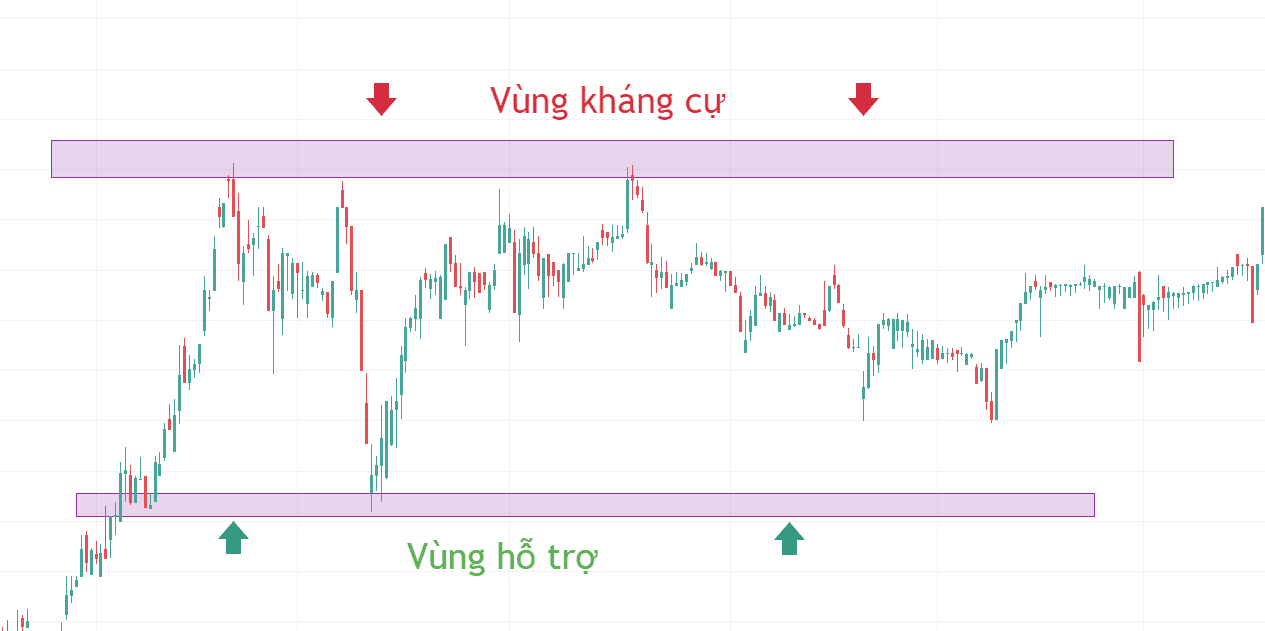
Support and resistance are two important concepts among technical stock indicators.
In essence, support and resistance are created by investor psychology. When a stock price falls to the support zone, investors become optimistic and buy in, causing the stock price to trend upwards. Conversely, when a stock price rises to the resistance zone, investors become pessimistic and sell out, causing the stock price to trend downwards.
There are many different ways to identify support and resistance zones. Some common methods include:
- Past peaks and troughs: Support zones are often formed at past troughs, while resistance zones are often formed at past peaks.
- Trendlines: A trendline is a straight line connecting past peaks or troughs. Support zones usually lie below a downtrend line, while resistance zones usually lie above an uptrend line.
However, investors should note that stock market indicators such as support and resistance are not always accurate. There are cases where the stock price may break through the support or resistance zone. Therefore, investors need to use support and resistance in combination with other factors such as fundamental analysis, trading volume, etc., in order to make accurate trading decisions.
What is the Simple Moving Average (SMA)?
The Simple Moving Average (SMA) is one of the stock indicators used to identify the price trend of an asset or a market over a given period. The SMA is calculated as the arithmetic average of closing prices over a given stock trading time period.
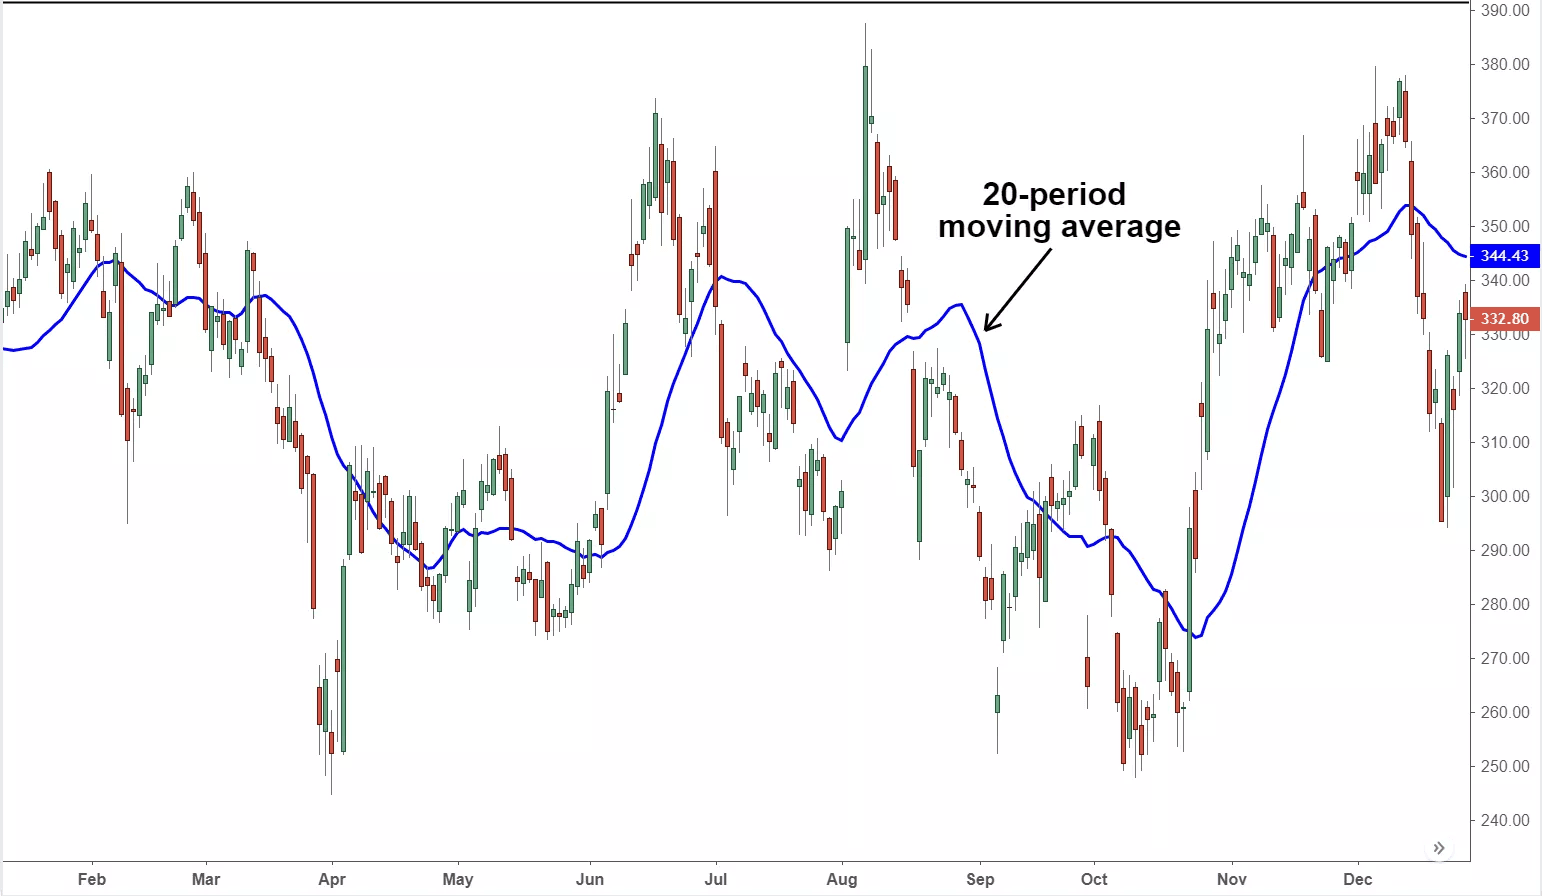
The Simple Moving Average (SMA) helps identify the price trend of an asset or a market.
If the SMA is used with a large number of sessions such as 50, 100, 200, it is a long-term indicator. Conversely, with a small number of sessions, for example 5, 10, 20, it is a short-term indicator. For example: the SMA 10 is calculated by taking the average price of the 10 most recent sessions, then connecting those points to create the SMA 10 line.
The SMA is a basic stock indicator and is commonly used in technical analysis. Investors can use the SMA for purposes such as:
- Identifying the price trend: When the SMA moves up, investors may buy that asset or market. Conversely, when the SMA moves down, investors may sell that asset or market.
- Identifying support and resistance zones: Investors can use the SMA to identify support and resistance zones, thereby making appropriate trading decisions.
- Identifying entry points: Investors can buy that asset or market when the price touches the support zone and sell that asset or market when the price touches the resistance zone.
- Identifying stop-loss points: Investors can place a stop-loss order at the support zone if the price falls below this zone, and place a stop-loss order at the resistance zone if the price rises above this zone.
However, the SMA is not always accurate. There are cases where the price of an asset or a market may move against the trend identified by the SMA. Therefore, investors need to use the SMA in combination with other factors in order to make accurate stock trading decisions.
What is the Relative Strength Index (RSI)?
The RSI (Relative Strength Index) is one of the important indicators in the stock market. This index compares the ratio between up days and down days, expressed through a value oscillating from 0 to 100 (with 50 as the midpoint). This indicator helps investors identify signs of a stock rising or falling. Investors can use the RSI to adjust overbought and oversold thresholds based on the current market trend.
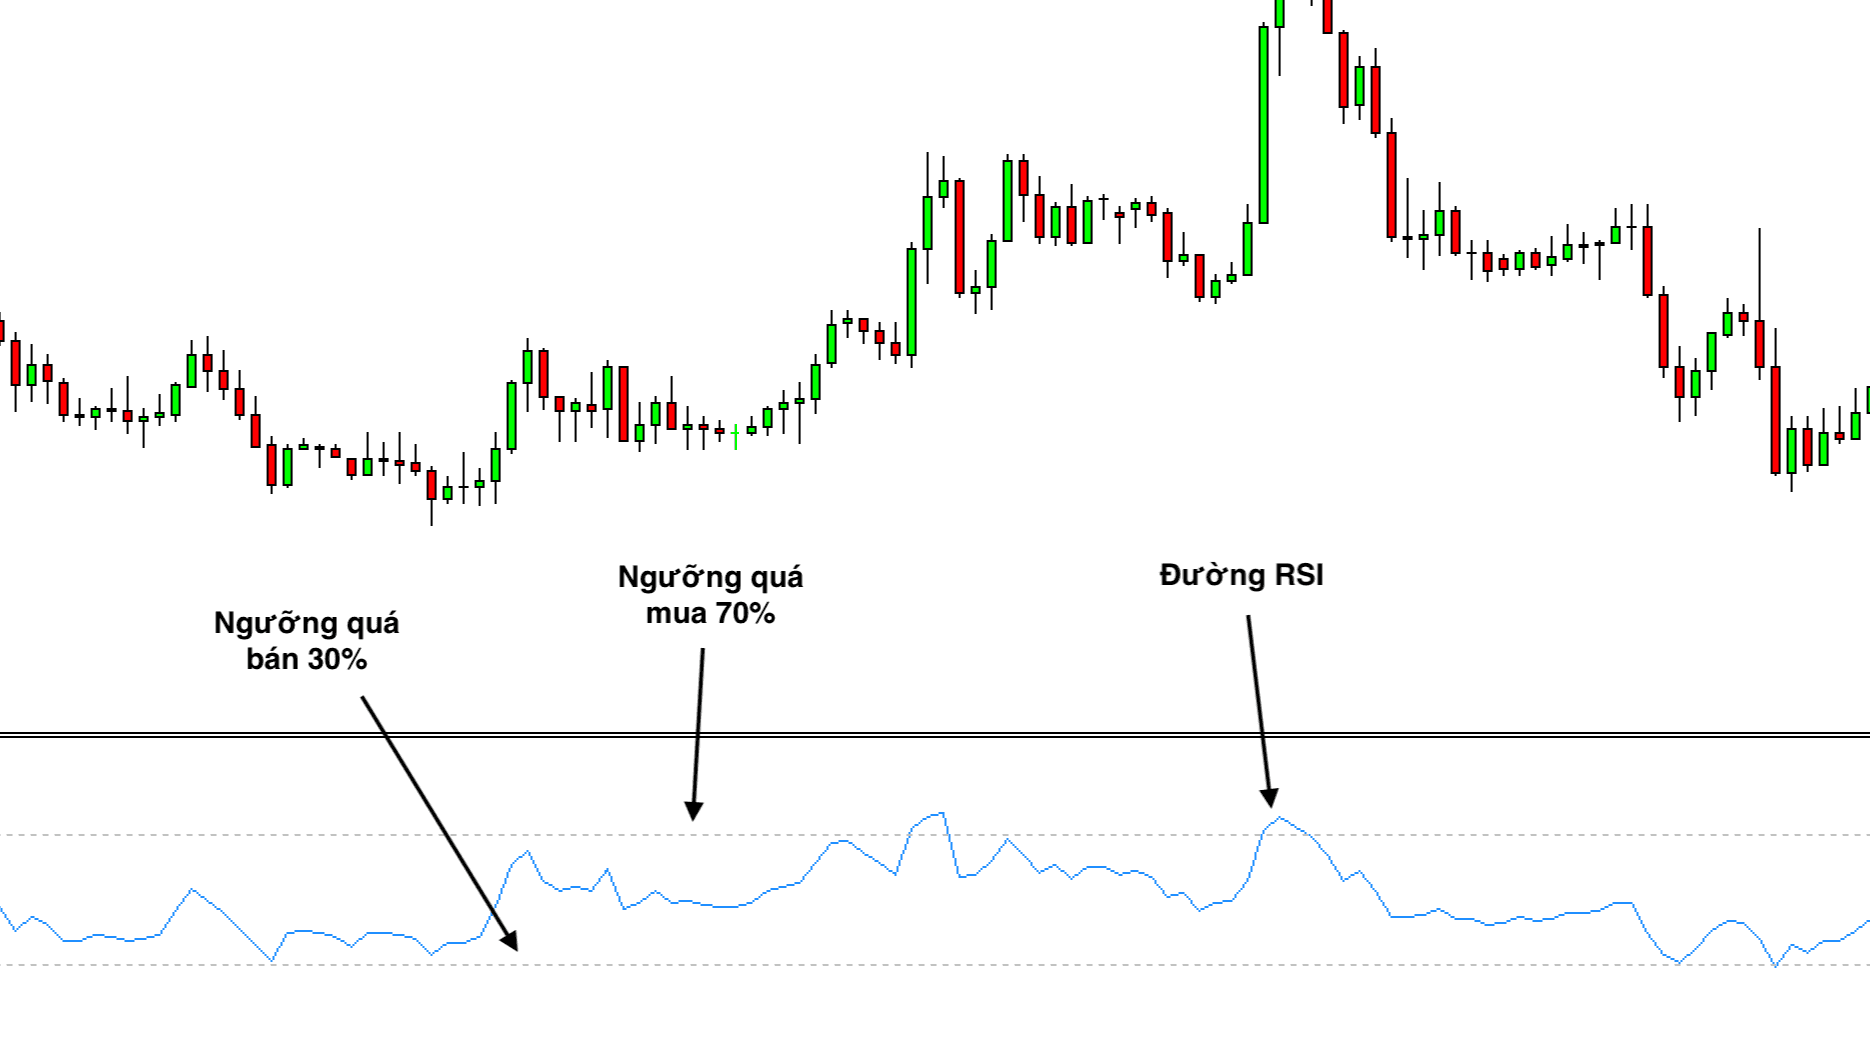
RSI is one of the stock indicators that helps compare the ratio between up days and down days.
When the RSI rises above 70, the stock may be in the overbought zone, indicating that the price has risen high. In this case, investors should consider reducing their buying. Conversely, when the RSI falls below 30, the stock may be in the oversold zone, a sign of a low price. Investors may want to limit selling stocks at this price level, as there may be potential for a recovery.
Investors may consider buying when the RSI is below 30 and consider selling when the RSI is above 70. However, combining the RSI with other stock indicators such as the SMA and Bollinger bands is a smart choice. This gives investors a more comprehensive view of the market, helps avoid situations where the price is too high based on the RSI alone, and helps identify suitable entry points through the combination with SMA and Bollinger Bands. The combination of these stock indicators is a useful tool to support investors in their securities trading decisions.
What is the MACD (Moving Average Convergence Divergence) line?
MACD stands for Moving Average Convergence Divergence. This is a stock indicator created in 1979 by Gerald Appel.
MACD consists of three main components:
- MACD line: The difference between the EMA (12) and the EMA (26), usually represented by a blue line.
- Signal line: This is the EMA (9) of the MACD line, usually represented by a yellow line.
- Histogram: Represents the difference between the MACD line and the Signal line, shown as green and red bars above and below the MACD line.
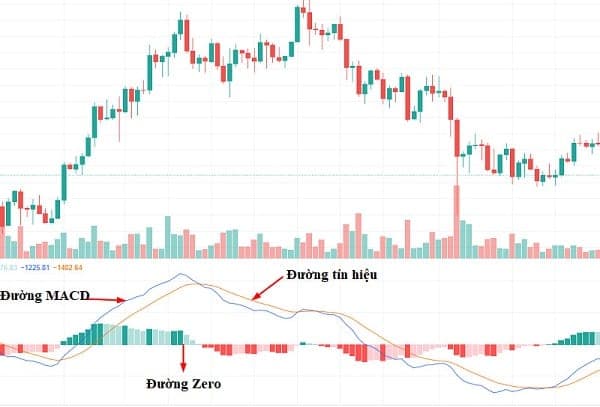
The main components of the MACD line.
The MACD line plays an important role in identifying a stock's trend and buy/sell points for stock investors.
When the MACD and the Signal line both rise, it is a signal of a strong uptrend, and a high Histogram further adds to the strength of that trend.
- When the MACD and Signal decline and the Histogram in between decreases, it is a sign of a strong downtrend in the medium term.
- When the MACD line crosses above the Signal line, it is a buy signal. Conversely, when the MACD line crosses below, it is a sell signal.
- If the later peak of the price candles is higher but the later peak of the MACD is lower, that is a negative divergence signal, showing that the stock's strength is weakening and the price may decline in the coming period.
Investors often use the MACD on its own or in combination with the RSI to identify entry points through crossover signals and to assess whether a price zone is "attractive" or not.
Conclusion
The above are just some of the common stock indicators, designed to assist in the technical analysis process and in learning stock investing for beginners·. With many different options available, it is important that investors choose the indicators that suit their trading strategy and have a deep understanding of how they work.
Shinhan Securities Vietnam (SSV) is one of the leading reputable securities companies in Vietnam, belonging to Korea's Shinhan Financial Group. Shinhan Financial Group has more than 20 years of operating experience, with a professional staff and a modern technology system. Choose Shinhan Securities Vietnam (SSV) - A solid choice for new stock investors.



