

APPLYING LONG-TERM AND SHORT-TERM CHARTS IN TECHNICAL ANALYSIS
Introduction
Short-term and long-term charts play an important role in technical analysis, in which:
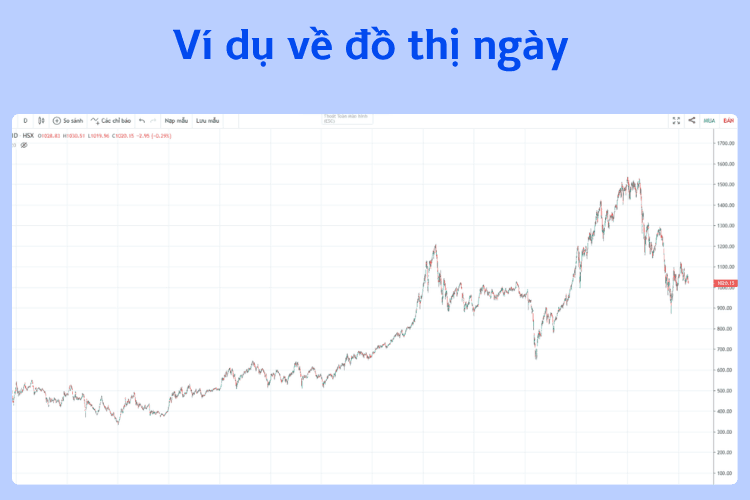
- Short-term chart: the daily chart, commonly used to forecast market movements over the short term.
- Long-term chart: the weekly/monthly chart, used to analyse and forecast longer-term trends.
1.1 What is a short-term chart?
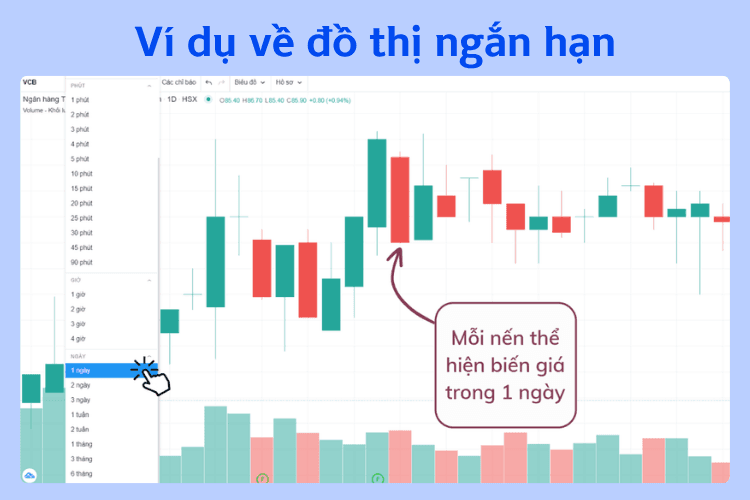
The short-term chart reflects short-term market fluctuations. The market is often driven by short-term developments, therefore the short-term chart is significant for investors and is widely used.
The time frame applied is mainly from six to nine months and each candle on the chart represents the price of one day.
(Each candle represents the price movement over 1 day)
???? When applying the short-term chart, daily price movements must be analysed in relation to the long-term trend of the market.
1. 2 Long-term chart
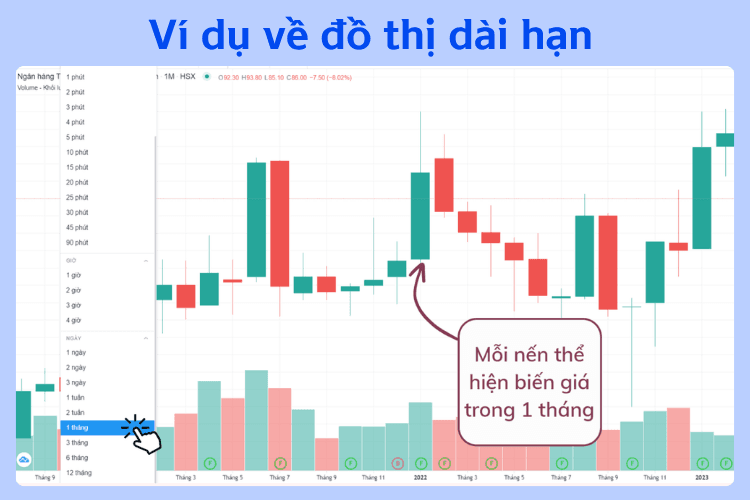
The long-term chart is used to analyse and forecast long-term trends from 5 – 20 years.
Each candle on the chart represents price movements over the range of:
- 1 month (monthly chart)
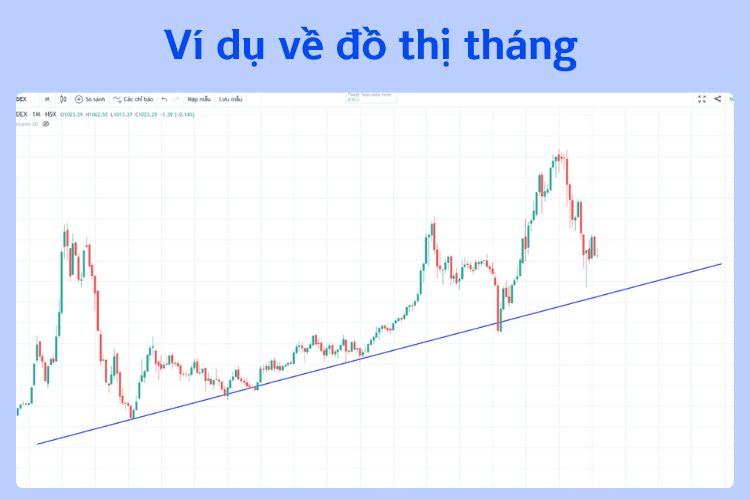
(Each candle represents the price movement over 1 month)
- 1 week (weekly chart)
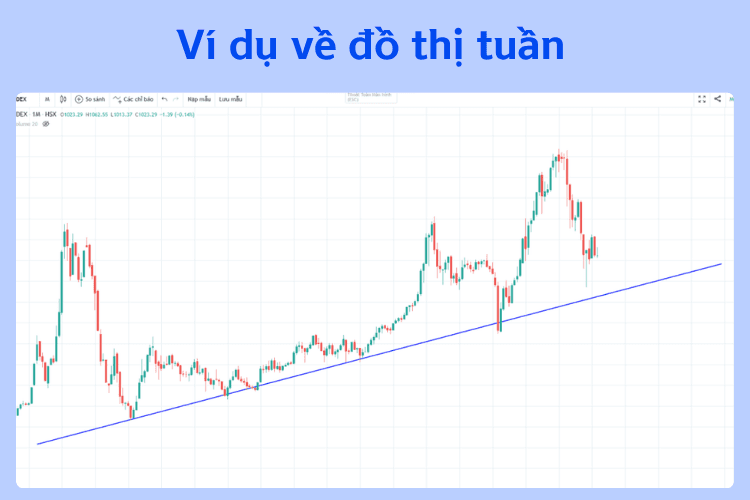
- 1 day) daily chart)
Characteristics
- A major advantage of technical analysis is that its principles, methods and indicators can be applied to any time frame (daily/weekly/monthly charts).
- The purpose of using weekly/monthly charts is to compress price movements into weekly/monthly ranges, thereby allowing the study of longer-term trends.
- The long-term chart gives us a view of the market trend that the short-term chart does not provide.
Comments:
The monthly and weekly charts show us the long-term trend of the VN-INDEX over 20 years. Meanwhile, it is very difficult to identify this trend with the daily chart.
Investors can take advantage of opportunities when prices touch the support line on the weekly/monthly chart to increase profitability.
03 How to apply the 2 types of charts in technical analysis
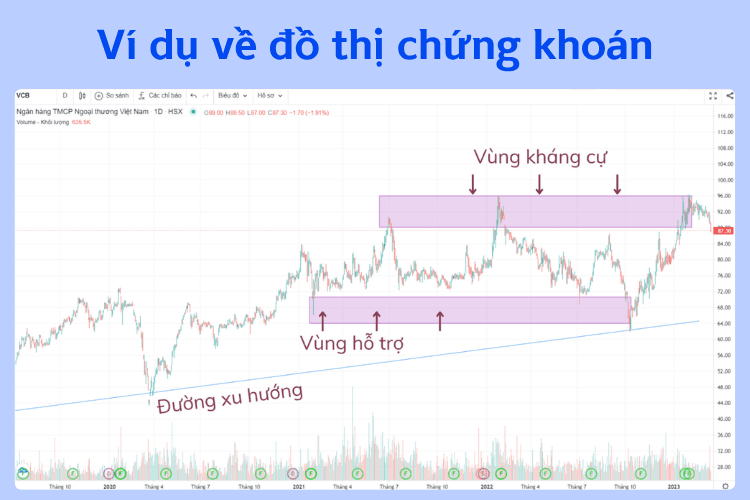
The appropriate sequence in chart analysis is to start with the long-term trend and then move on to analysing the short-term trend.
Reason:
By starting with the long-term trend, investors will know where the market stands within the long-term trend, and from there make appropriate decisions when applying it to the short-term trend.
The first chart to be examined is the monthly chart with a time cycle of 20 years.
The analyst needs to assess the major trends, resistance/support lines and long-term patterns.
We hope that the investment knowledge from Shinhan has helped investors better understand the business results report
(!) This article is for informational purposes only and does not constitute investment advice. Readers should conduct their own research or consult an expert before making financial decisions.



