
1. Price Board Monitoring & Watchlist Setup
A. Trading data price board:
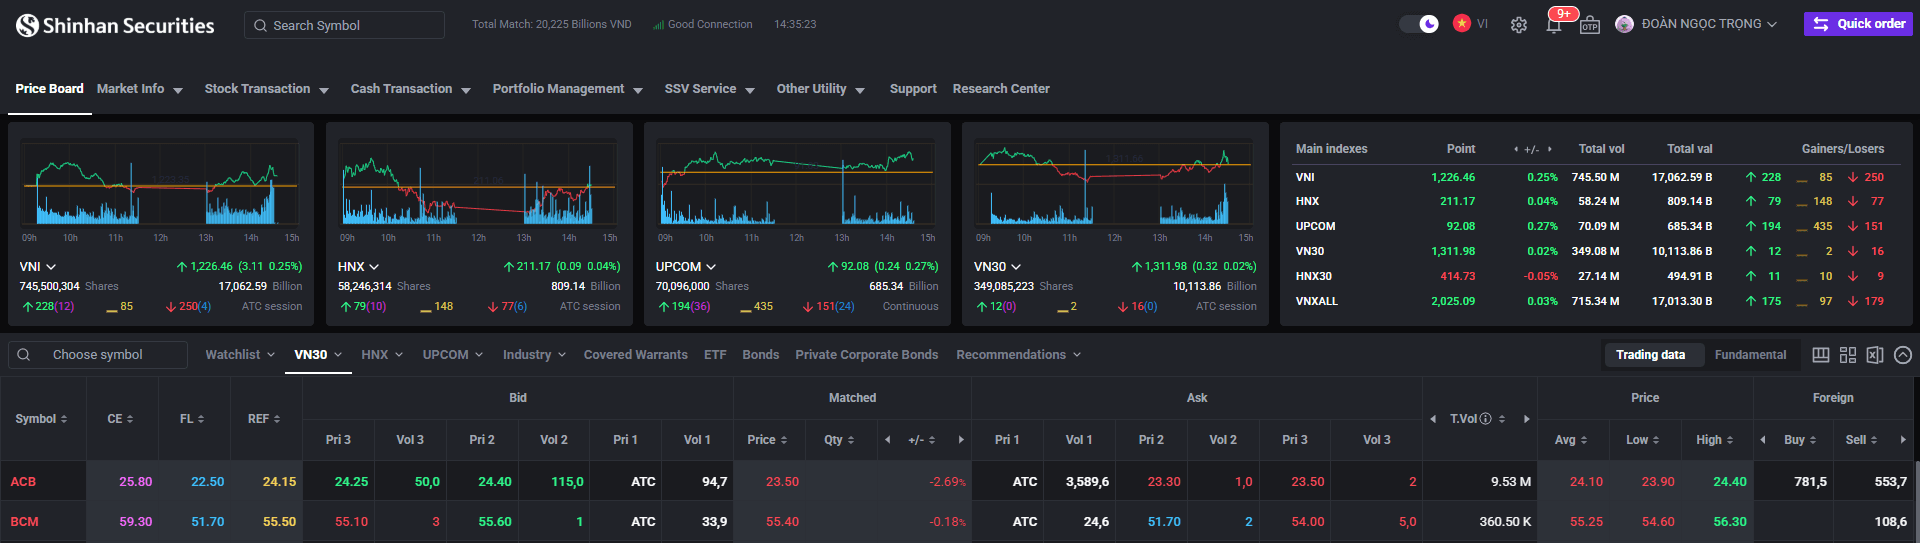
By default, the basic price board displays the investor’s currently held stock portfolio.
Investors can view stock prices by exchange. On the [Home] screen, select the exchange name (e.g., HOSE, HNX, UPCOM, Covered Warrants, etc.) to monitor its listings.
Displayed basic stock information:
Stock Code.
Ceiling Price: mức giá cao nhất theo biên độ của 1 cổ phiếu theo quy định.
Floor Price: the lowest price limit of a stock within its regulated trading band.
Reference Price: the closing price of the stock from the previous session (for HOSE and HNX), or the average price from the previous session (for UPCOM).
Bid and Ask: shows the prices and volumes closest to the matched price on both the buy and sell sides.
Total Volume: the total trading volume of the stock during the session.
High Price: the highest price the stock reached during the trading day.
Low Price: the lowest price the stock reached during the trading day.
B. Fundamental price board:
The basic price board displays key financial indicators for the selected list of stock symbols.
Key financial indicators:
ROA: Measures the profitability relative to its total assets.
ROE: Indicates how effectively equity capital is used to generate profit.
P/B: Compares a company’s market value to its book value.
P/E: Shows the relationship between a stock’s price and its earnings per share.
EPS: Represents the net profit allocated to each outstanding share.

C. Creating a Watchlist
Step 1: On the [Home] screen, select [Watchlist].
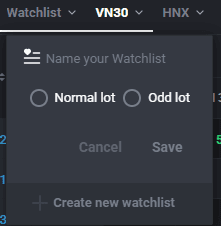
Step 2: Click the [Create New Watchlist] button.
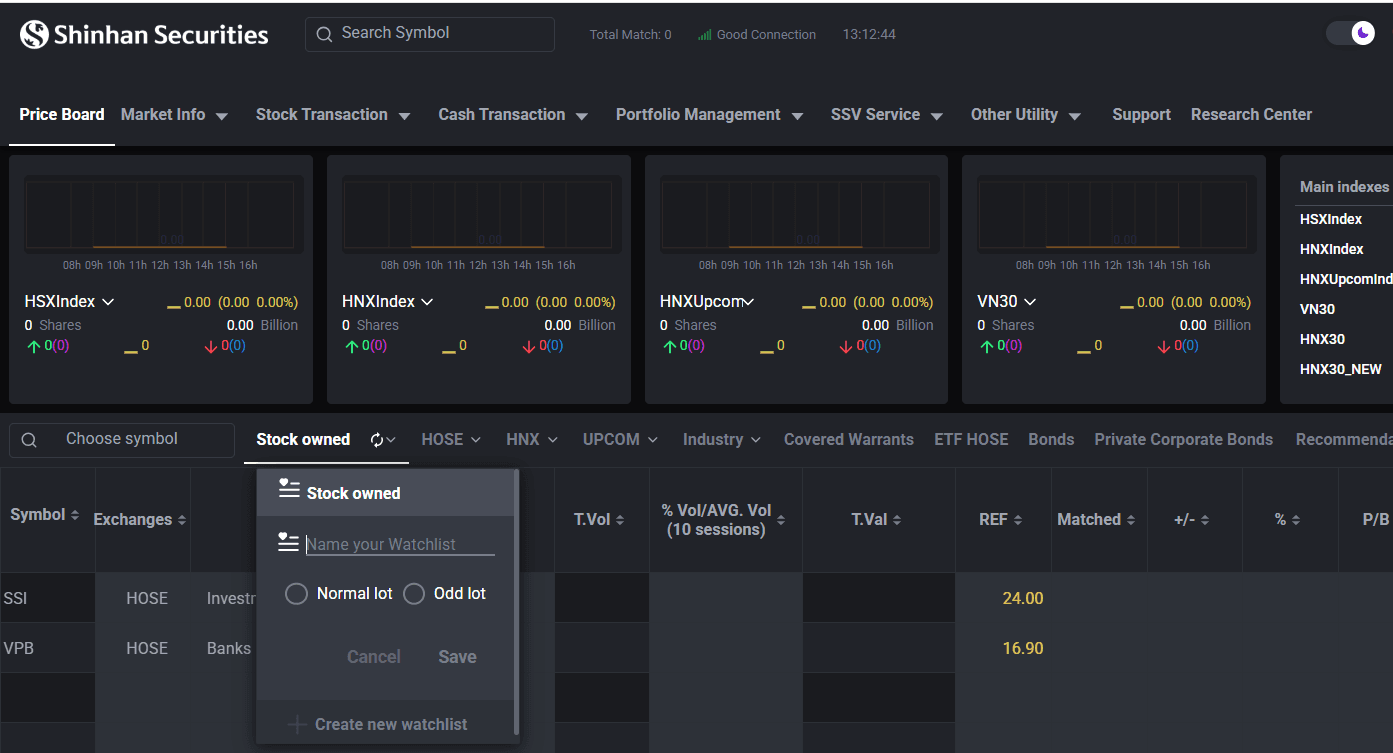
Step 3: Name the new watchlist and choose either [Normal Lot] or [Odd Lot], depending on your tracking preference.
Step 4: Click [Save] to save the watchlist.
Step 5: Enter the desired stock codes and confirm to include them in your watchlist.
D. Recommendation Watchlist
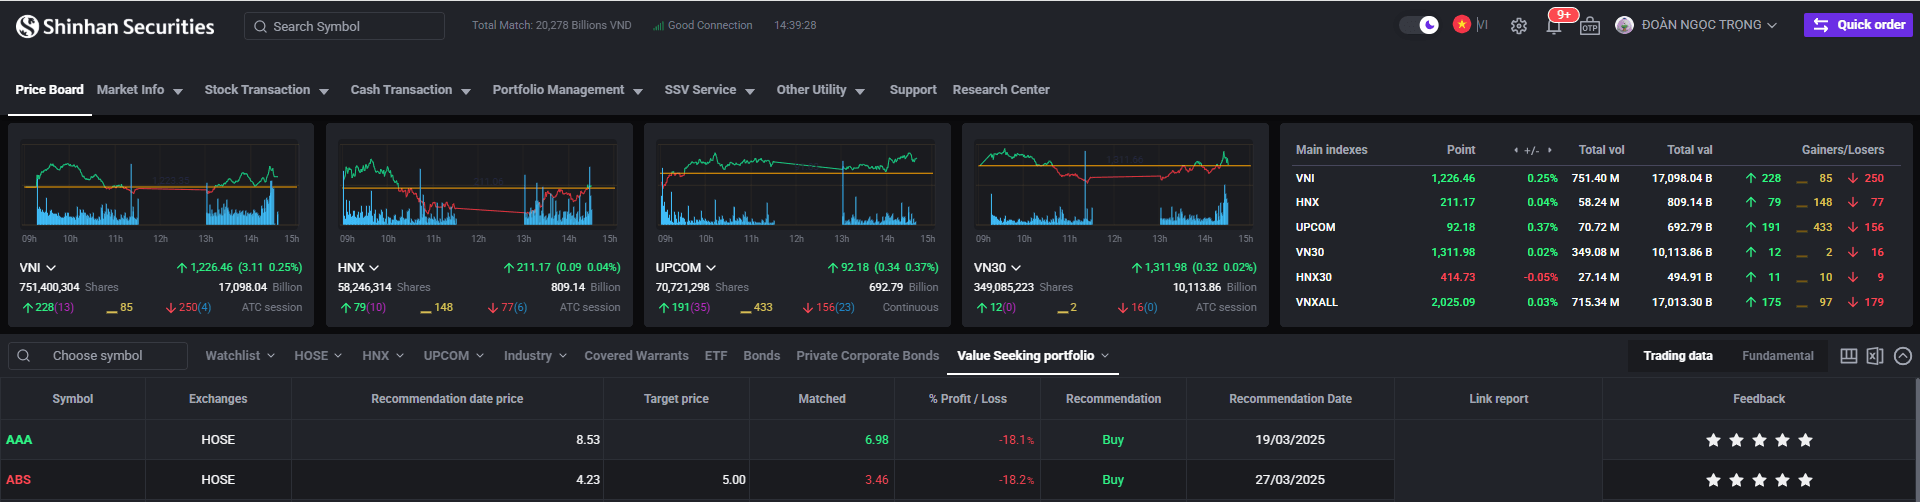
On the [Home] screen, go to [Recommendations], and select the appropriate recommended watchlist to track stocks suggested for buy/sell actions by SSV.
2. Tracking Other Investment Information Instruction
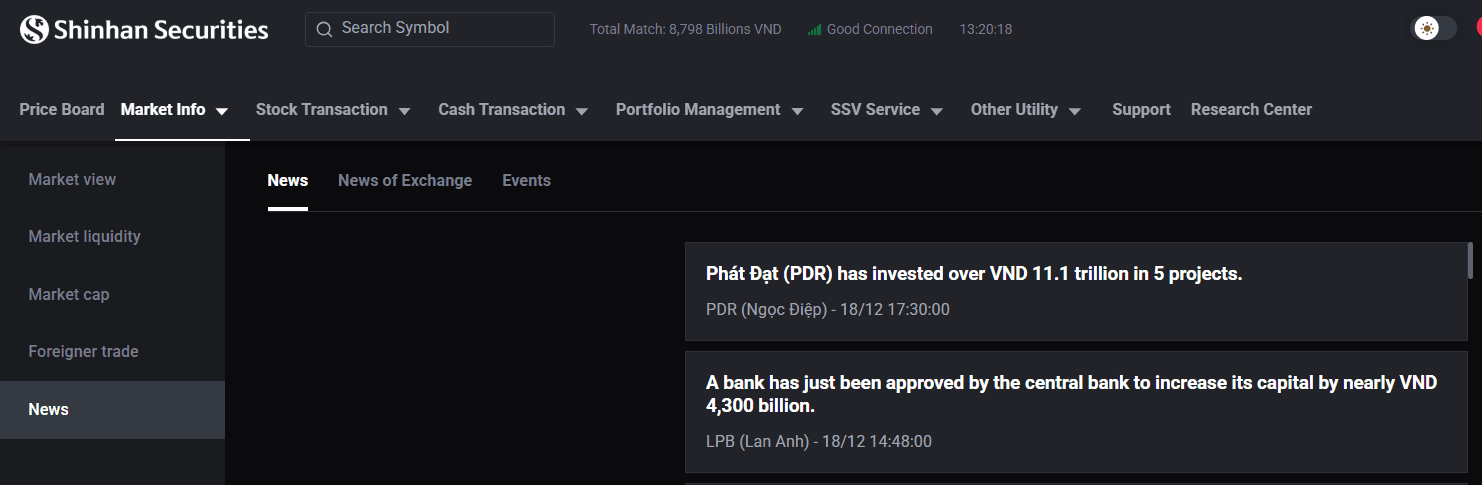
Step 1: From the [Home] screen, select [Market Infor].
Step 2: Select from the available market sections to view detailed data.
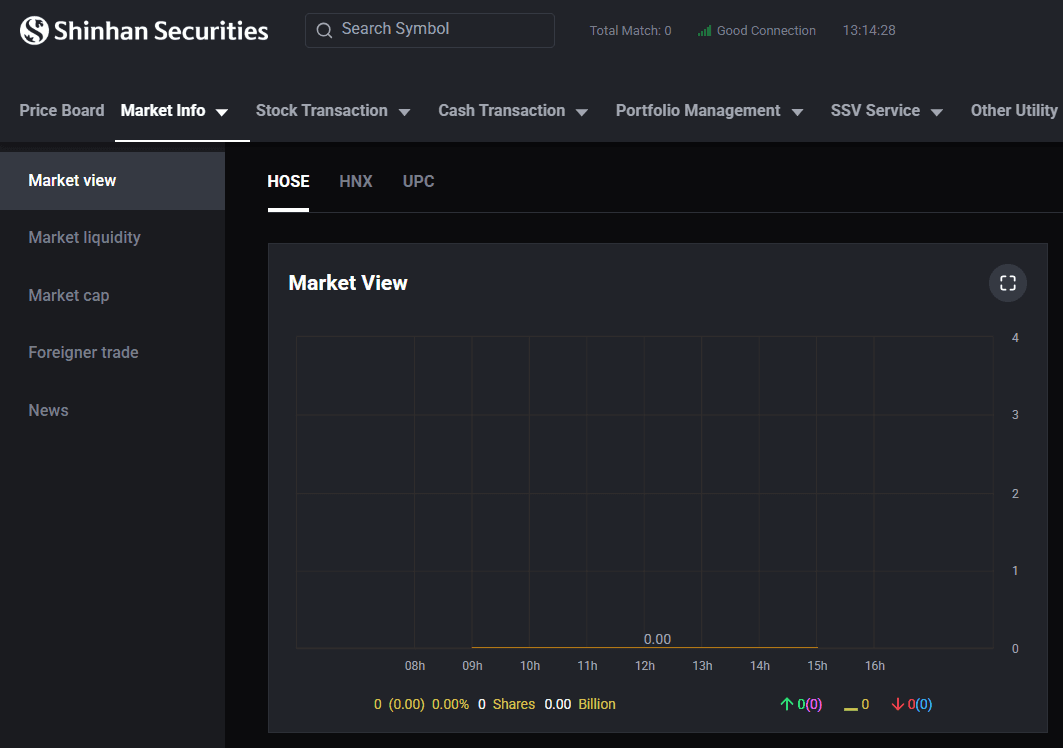
A. Market View
Investors can monitor key in-depth market indicators such as:
Market Depth
Capital Flow
Top Trading Stocks
Market Insights & Reports
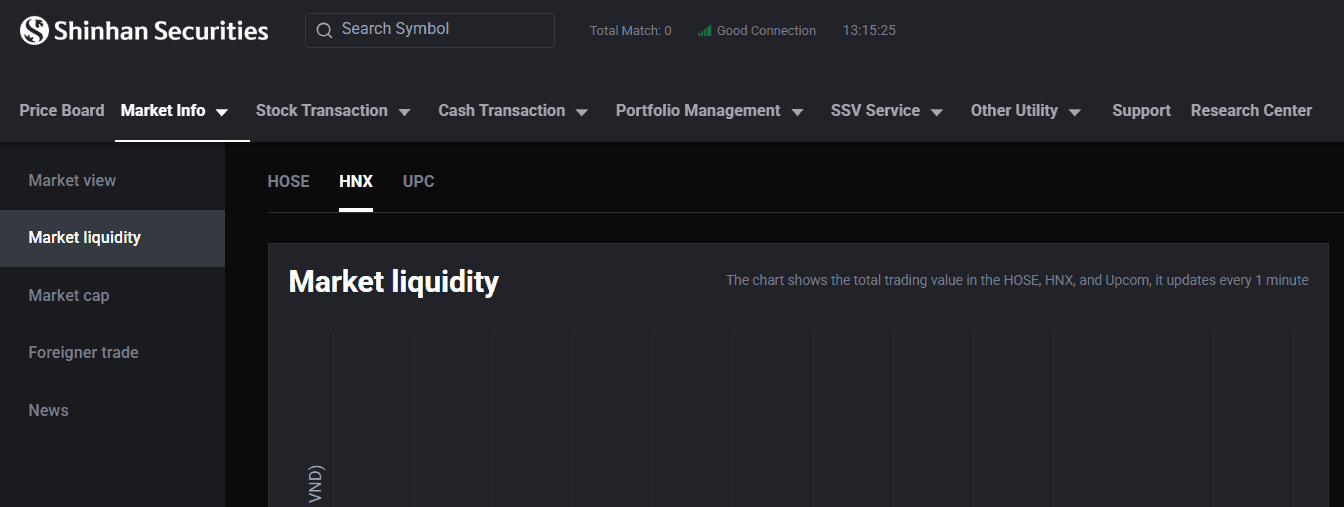
B. Market Liquidity
Investors can monitor changes in overall market liquidity.
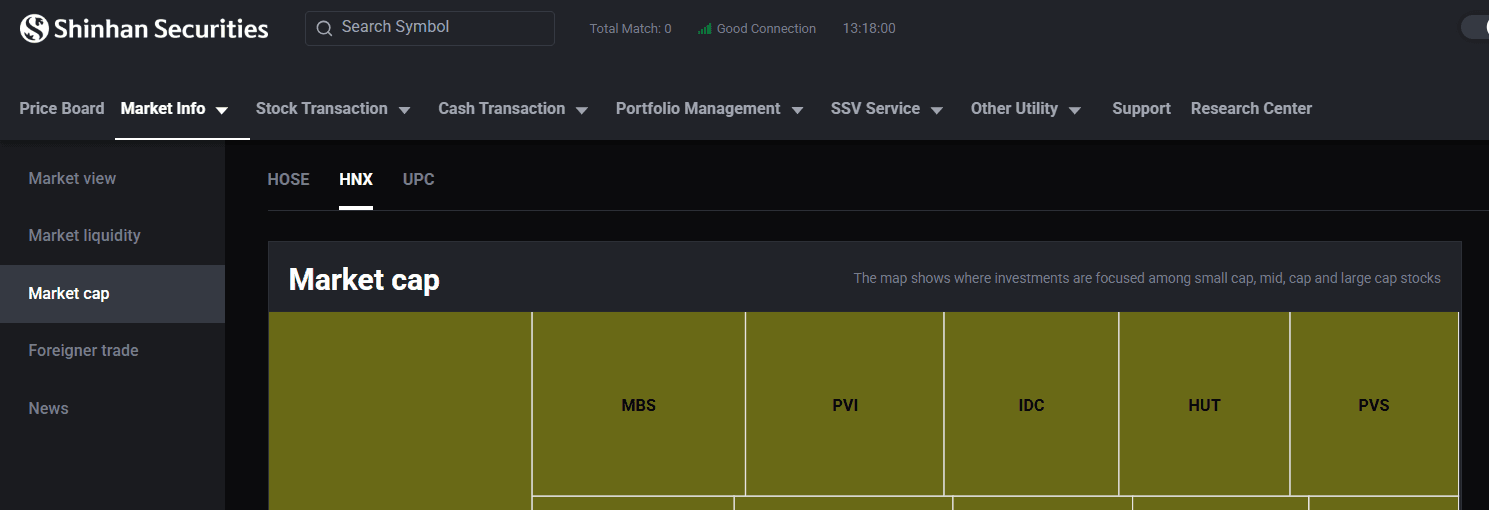
C. Market Capitalization
Investors can monitor capital movement within the market.
Investors can track capital inflow ratios across listed stocks.
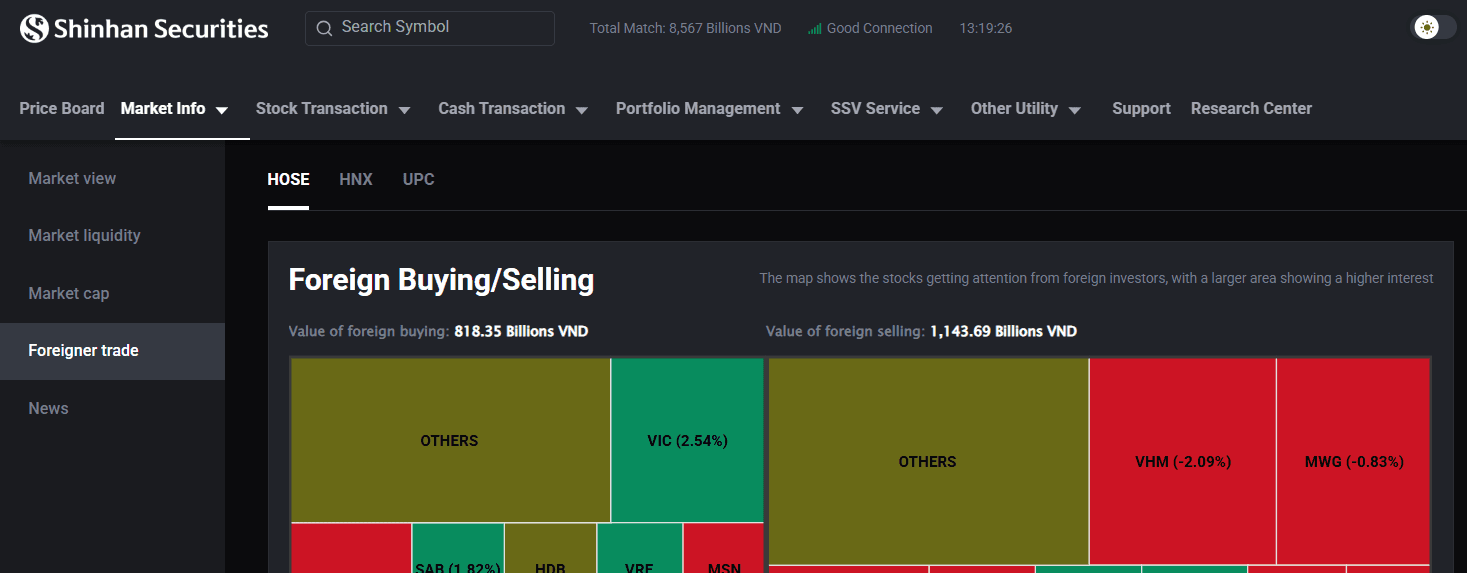
D. Foreigner Trade
Investors can monitor foreign investor trading activity and its fluctuations.
E. News
Investors can follow market news and updates in real time.
3. Research Center
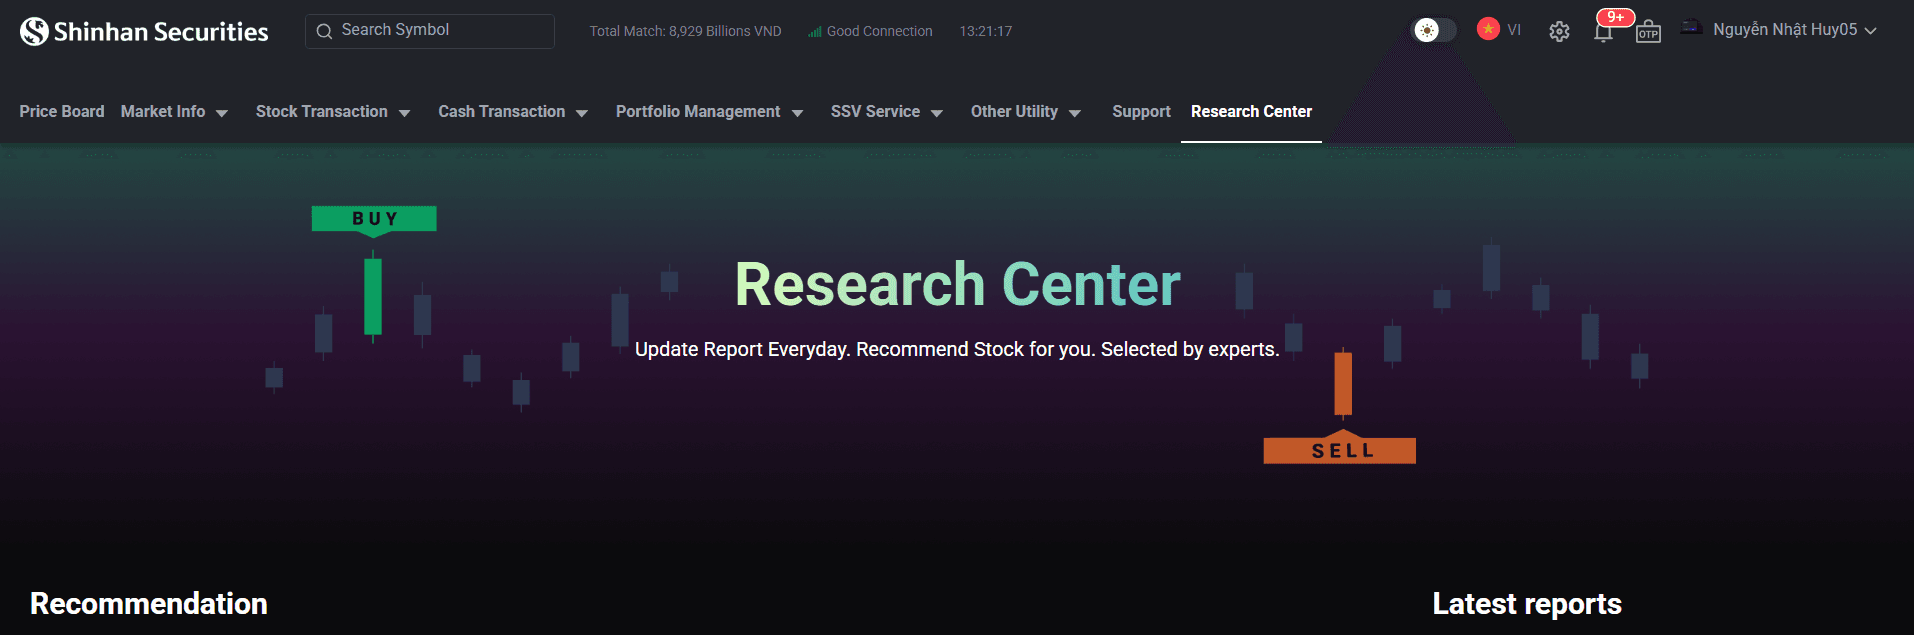
Investors can access stock recommendations and morning briefings via the [Research Center]. From the [Home] screen, select [Research Center] to stay updated with investment content.
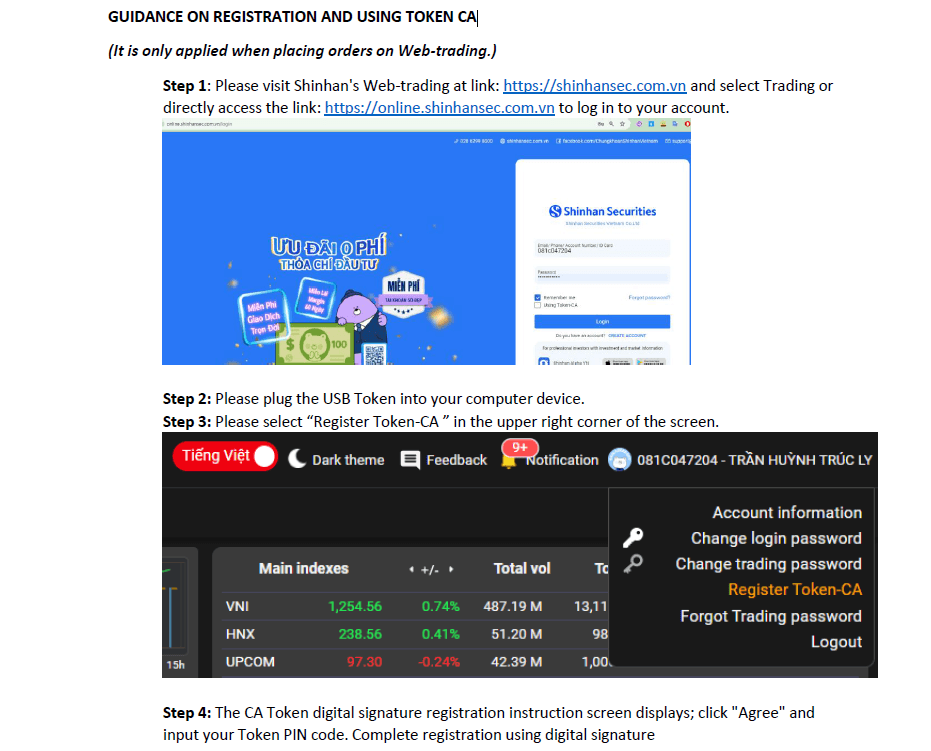
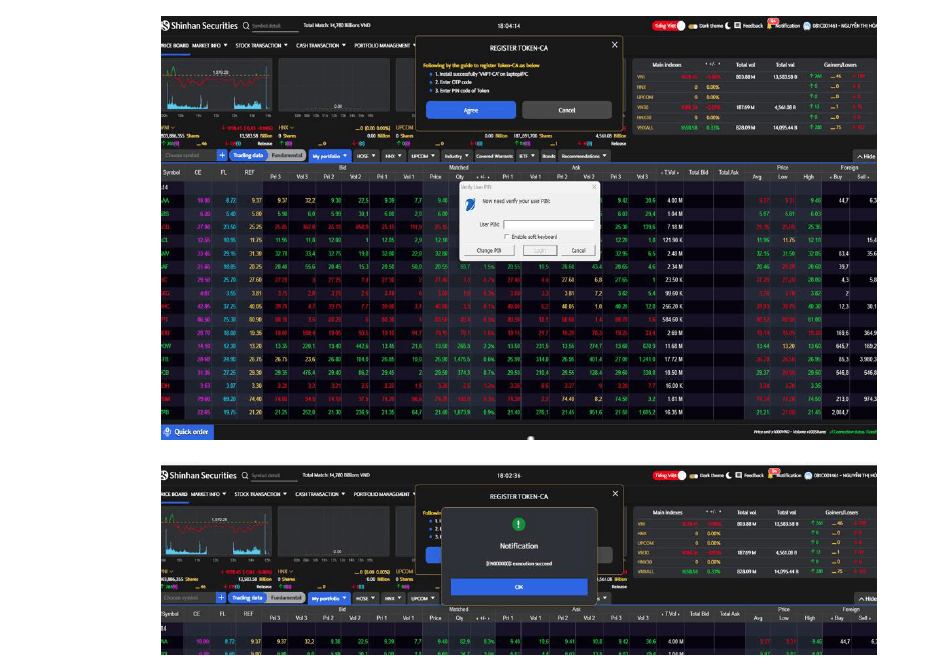
GUIDANCE ON REGISTRATION AND USING TOKEN CA
Updated: 19 Sept 2026