
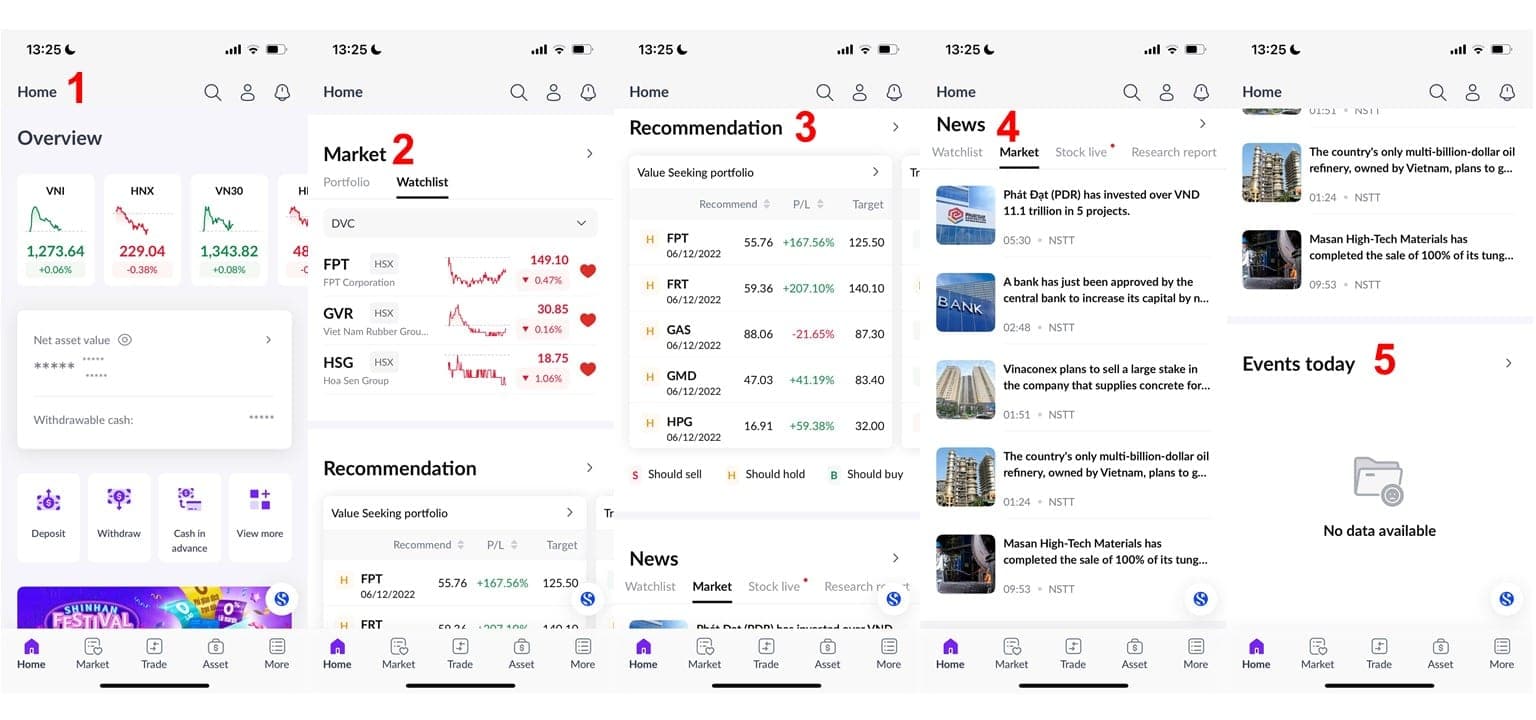
1. Guide to Monitoring Market Overview Information
Market Movements: Go to the [Overview] section on the [Home] screen (1).
Stock Performance in Favorite/Owned Portfolio: Access the [Market] section on the [Home] screen (2).
SSV’s Recommended Portfolios: Check the [Recommendation] section on the [Home] screen (3).
Market News: Find updates in the [News] section on the [Home] screen (4).
Today’s Events: View the [Events today] section on the [Home] screen (5).
2. Information Available for Monitoring
Price Board: Go to [Market] and select [Price Board].
Stocks by Sector: Go to [Market] and select [Industries].
ETF Funds: Go to [Market] and select [ETF].
Listed Bonds: Go to [Market] and select [Bonds].
Covered Warrants: Go to [Market] and select [CW].
Negotiated Transactions: Go to [Market] and select [Put-through].
3. Creating and Managing a Watchlist
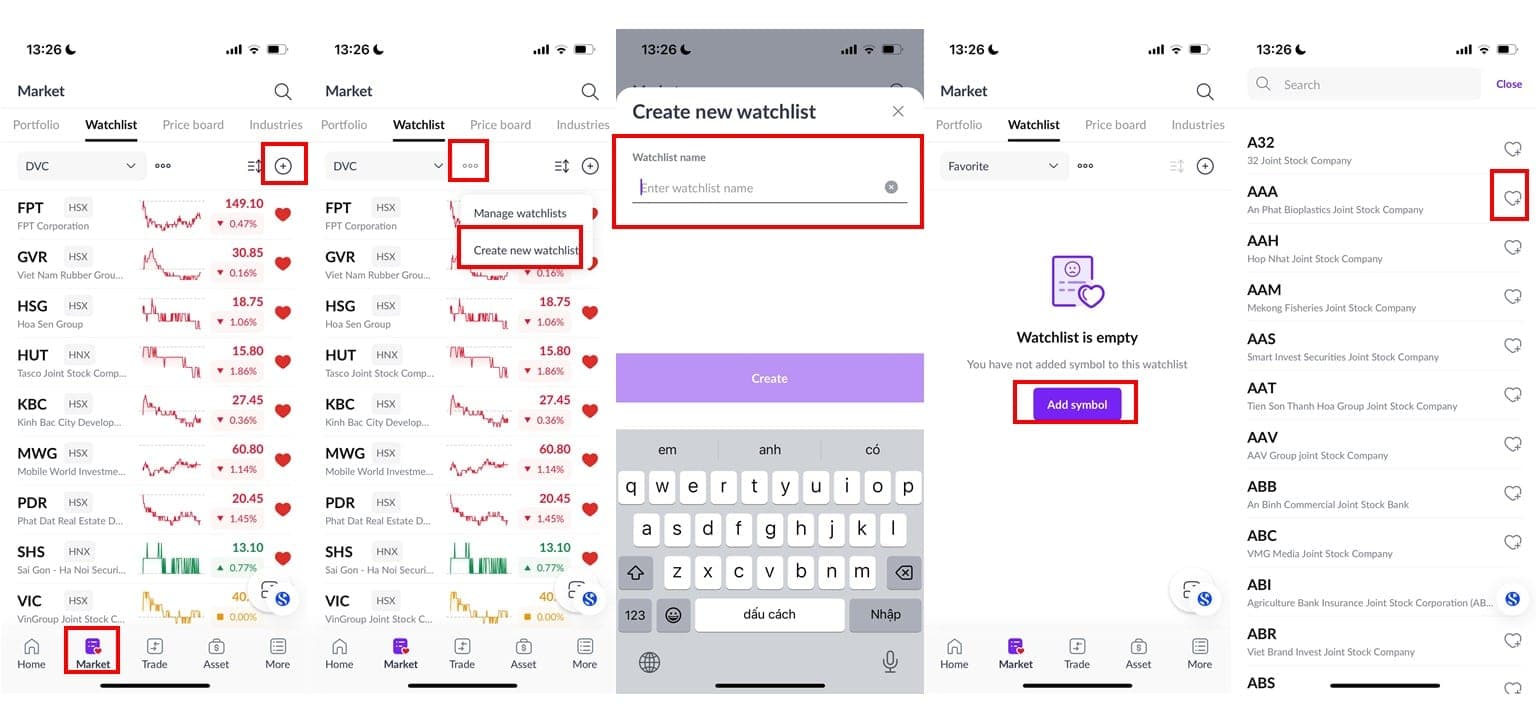
The Favorite Watchlist is a list you create to easily track your preferred stock codes. To create a Favorite Watchlist, please follow these steps:
Step 1: On the [Home] screen, press the “>” button in the [Market] section or directly select the [Market] button from the list below.
Step 2: Press the menu icon
 and select [Create New List].
Step 3: Enter a name for the new watchlist and press [Create].
Step 4: Press [Add Symbol] to search for your favorite stocks, then press the icon
 to add the stock to the list.
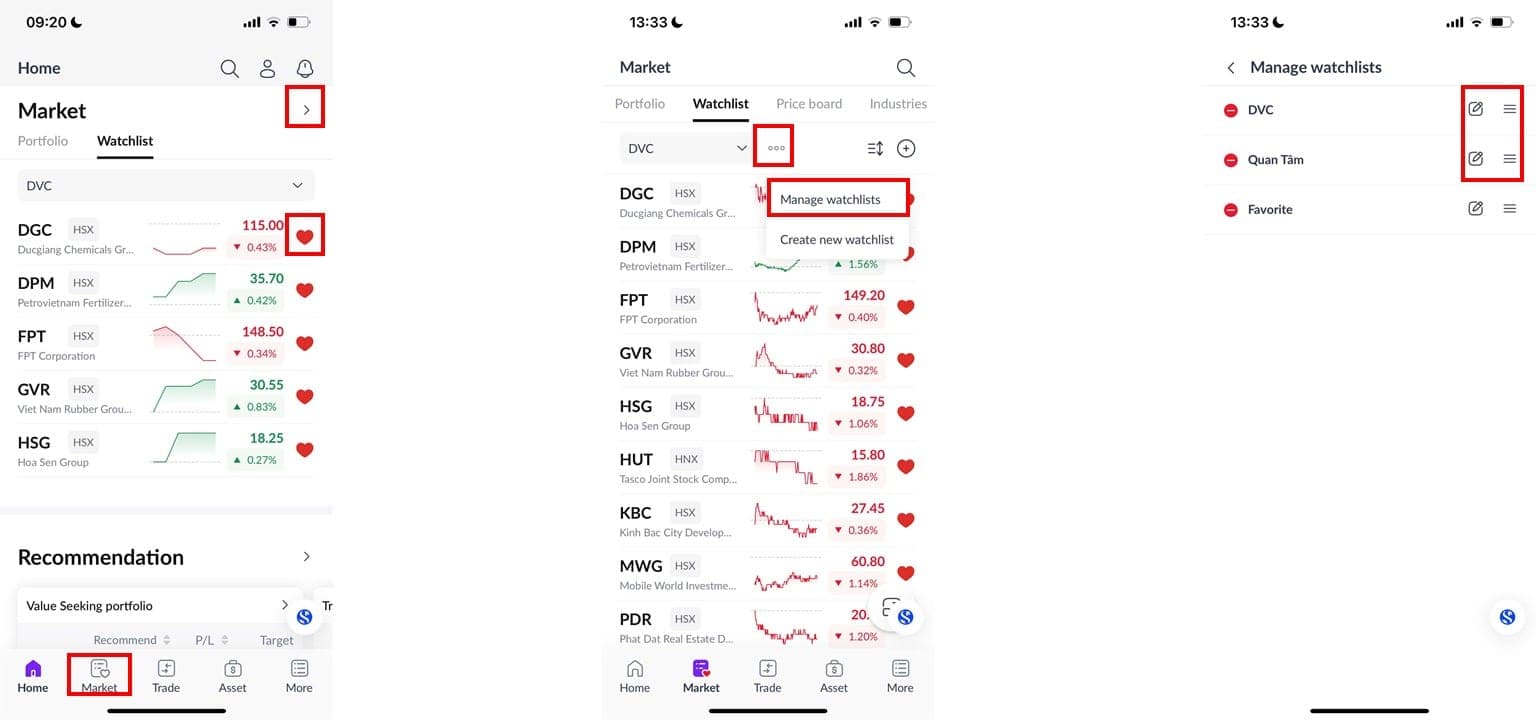
To manage your watchlists and add or remove stock codes, please follow these steps:
Step 1: Press the menu icon
and select [Manage Watchlists].Step 2: Use the icon
 to rearrange the order of watchlists for prioritized display from top to bottom, or use the icon
 to adjust the watchlist name.
Step 3: To remove a stock from a watchlist, press the icon
 next to the stock you wish to remove.
4. Guide to Monitoring Detailed Stock Information
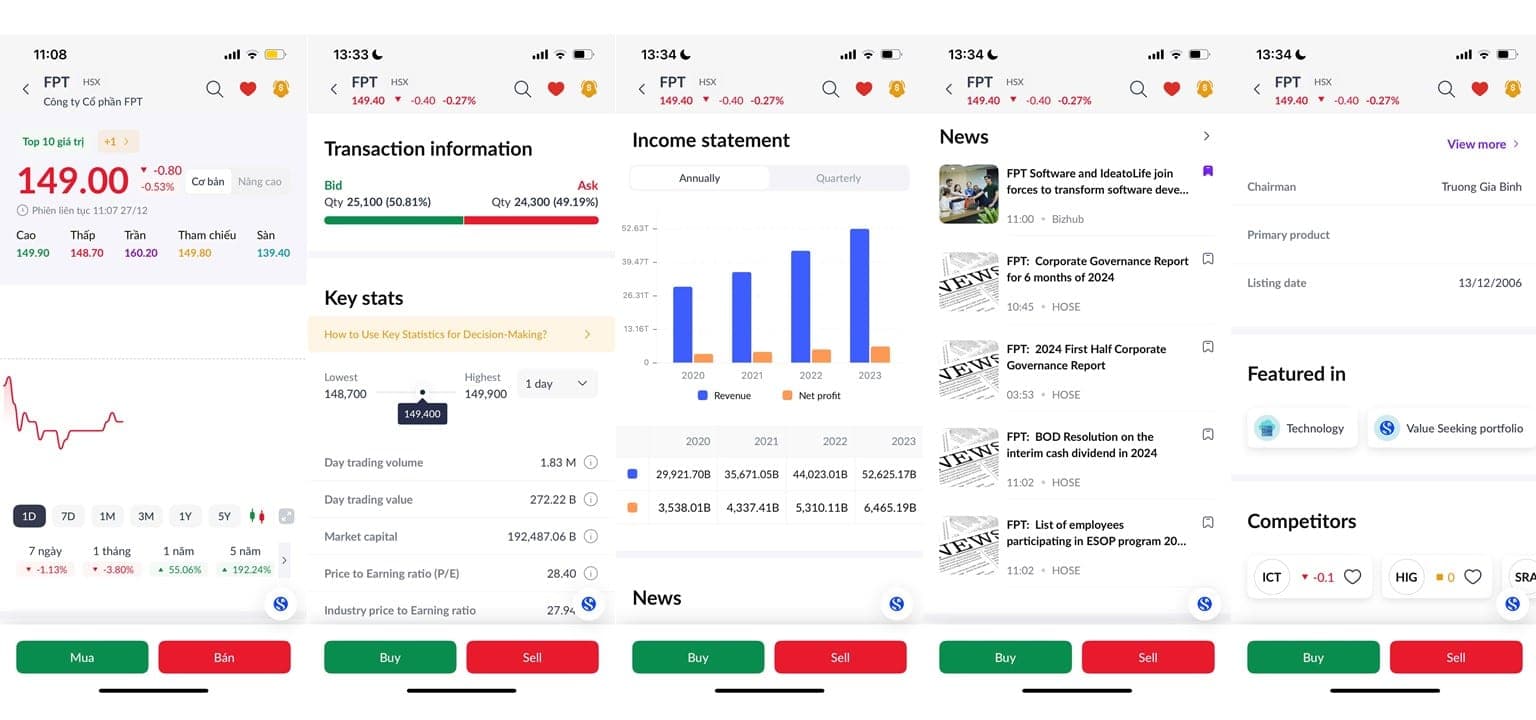
When you click on a stock code or press the [Stock Info] button, you can choose to view detailed stock information in either [Lite] or [Pro] mode.
4.1. Stock Information in [Lite] Mode includes:
The stock value and related price information.
Charts with selectable timeframes to track price movements and fluctuations over specific periods.
Transaction information, including the correlation between buying and selling parties, as well as key trading indicators based on the selected time period.
Income reports based on the chosen timeframe.
News, company information, leadership, and main products.
The sector the stock belongs to, recommended investment portfolios, and competitor companies within the same industry.
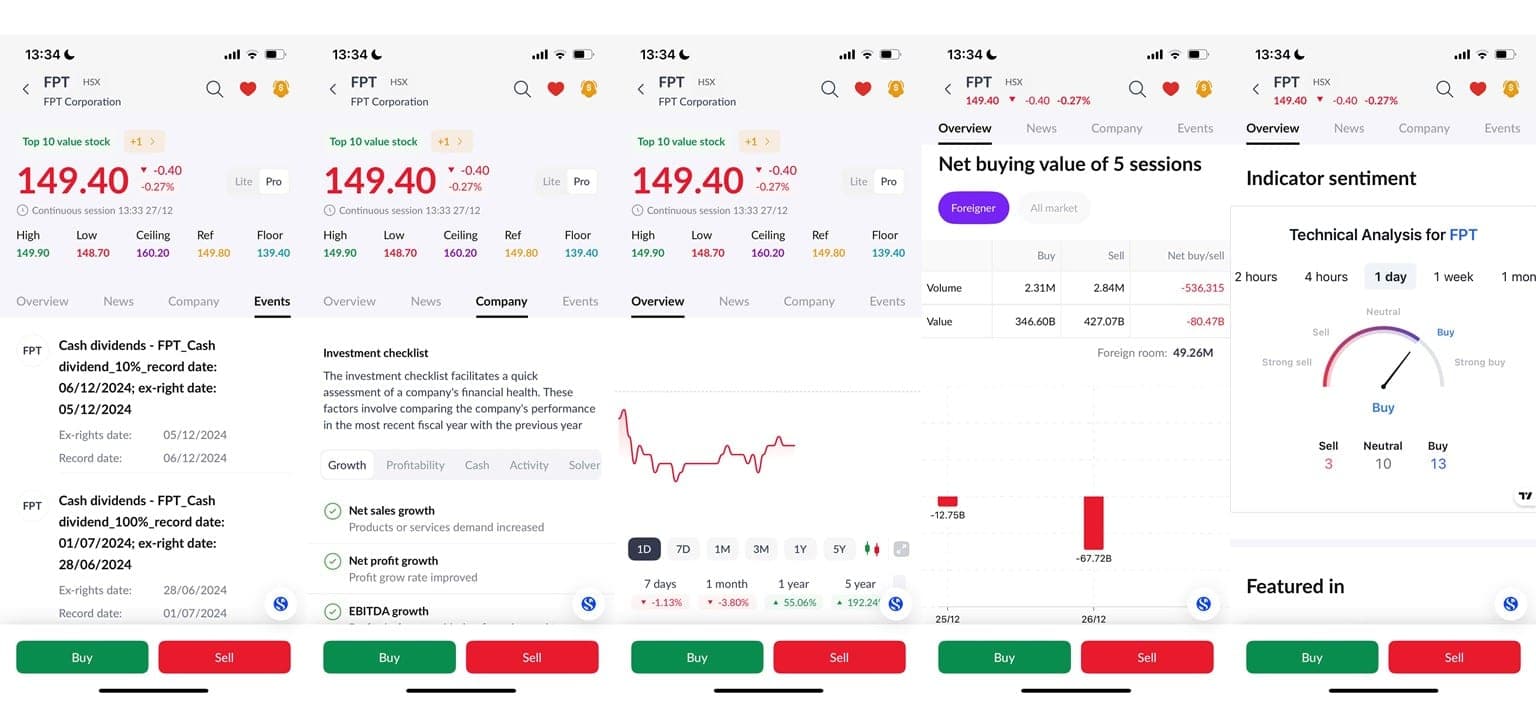
4.2. Stock Information in [Pro] Mode includes all the information in [Lite] mode, plus:
Dividend events, shareholder meetings, etc.
Company indicators, where a green check “ü” indicates positive performance and a red cross “û” indicates unsatisfactory conditions.
Information on trading volume, net buying value, and market sentiment comparison indices.
Updated: 19 Sept 2026